Quantitative Analysis of the “German.Credit” Dataset Using Logistic Regression

Dr. O. Aly
Computer Science

Abstract

The purpose of this project is to analyze the German Credit dataset. The project is divided into two main Parts.  Part-I evaluates and examines the DataSet for understanding the Dataset using the RStudio.  Part-I involves six significant tasks.  Part-II discusses the Pre-Data Analysis, by converting the Dataset to Data Frame, involving four significant tasks to analyze the Data Frames.   Although the project analyzes three significant models including Standards Linear Regression, Multiple Linear Regression, the  Logistic Regression is the emphasis of this project.  The result shows that the duration, amount, installment and rent show positive coefficient values indicating that they have a positive impact on the probability of the dependent binary outcome (Default).  As the p-value is much less than 0.05 for duration, amount, installment, history, purpose for used car, goods, repair, and business, and rent, we reject the null hypotheses that there is no significance of the parameter to the model and accept the alternate hypotheses that there is significance of the parameter to the model.  The p-value for the age is (p=0.05) indicating that we accept the null hypothesis that there is no significance of the parameter to the model.  The p-value for (purpose) of education is > 0.05 indicating that we accept the null hypothesis that there is no significance of the parameter to the model.  The performance of the Logistic Regression model for the test dataset shows that the Logistic Regression recognizes 23 of the 28 Defaults (82%) and predicts the defaults 42 of the 72 good loans (58%). 

Keywords: German-Credit Dataset; Regression; Logistic Regression Analysis Using R.

Introduction

This project examines and analyze the dataset of (german.credit.csv).  The dataset is downloaded from the following archive site for machine learning repository:

https://archive.ics.uci.edu/ml/datasets/Statlog+(German+Credit+Data).

The dataset has 1000 obeservation on 22 variables. There are two datasets for german.credit.csv.  The original dataset, in the form provided by Professor Hofmann, contains categorical/symbolic attributes and is in the current german.credit.csv file which is used in this project.  The other dataset “german.data-numeric” is not used in this project which was developed by Strathclyde University for algorithms that need numerical attributes.  This project utilized the original version of german.credit.csv which has categorical variables, because these categorical variables will be transformed during the analysis process to generate various models including linear models, and logistic model.

There are two Parts for this project.  Part-I addresses five tasks to examine and understand the dataset using R before the analysis as follows:

  • Task-1: Review the Variables of the Dataset
  • Task-2: Understand the Dataset using names(), head(), and dim() functions
  • Task-3: Pre and Post Factor and Level of Categorical Variables of the Dataset.
  • Task-4: Summary and Plot the Continuous Variables: Duration, Amount, and Installment
  • Task-5: Classify Amount into Groups.
  • Task-6: Summary of all selected variables.

Part-II address the analysis using R. Part-II includes seven tasks include the following. These seven tasks are followed by the discussion and analysis of the results. 

  • Task-1: Select and Plot Specific Variables for this Project.
  • Task-2:  Model-1:  Linear Regression – single variable, and Diagnostic Analysis.
  • Task-3:  Model-3:  Multiple Regression Analysis
  • Task-4:  Discussion and Analysis.

There is an assumption that, on average, lending into default is five times as costly as not lending to a good debtor (default=success=0, no default=failure=1).  The default is defined as “success,” while no defaulting on a loan is defined as “failure.”   If a certain (p) for the probability of default is estimated, the expected costs are 5p, assuming the bank makes the loan, and 1(1-p) if the bank refuses to make the loan. Thus, if 5p < 1-p, the bank can expect to lose less by making the loan than by turning away business.  The following decision rule can be implied: make the loan if the probability of default p < 1/6.  The prediction of Default (Success) is to implemented whenever p > 1/6.

This project analyuze the German Credit dataset.  The two expected outcomes are success (defaulting on the loan), and failure (not defaulting on the loan).  This project implements three models, Linear Regression, Multiple Linear Regression.  However, the emphasis of this project is on the Logistic Regression (Model-3) to estimate the probability of default, using continuous variables (duration, amount, installment, age), and categorical variables (loan history, purpose, rent) as explanatory variables (independent variables).

Various resources were utilized to develop the required code using R. These resources include (Ahlemeyer-Stubbe & Coleman, 2014; Fischetti, Mayor, & Forte, 2017; Ledolter, 2013; r-project.org, 2018).

Part-I:  Understand and Examine the Dataset “german.credit.csv”

Task-1:  Review the Variables of the Data Sets

The purpose of this task is to understand the variables of the dataset.  The dataset is “german.credit” dataset.  The dataset describes the clients who can default on a loan.  There are selected variables out of the 22 variables which are target for this project.  Table 1 and Table 2 summarize these selected variables for this project.  Table 1 focuses on the variables with binary and numerical values, while Table 2 focuses on the variables with categorical values.

Table 1:  Binary (Default) and Continuous (Numerical) Variables

Table 2: Categorical Variables.

Task-2:  Load and Understand the Data Sets Using names(), head(), dim() functions.

            The purpose of this task is to load and understand the data set using names(), head(), and dim() functions as shown in the code below.

  • gc <- read.csv(“C:/CS871/german.credit.csv”)
  • names(gc)
  • head(gc)
  • dim(gc)
  • gc[1:3,]

Task-3:  Pre and Post Factor and Level of Categorical Variables of the Data Sets

            The purpose of this task is to factor and level all categorical variables and show the result pre- and post this process as shown in the code and snapshots below.

  • ### history categorical variable pre and post factor and level.
  • summary(gc$history)
  • plot(gc$history, col=”green”, xlab=”History Categorical Variable Pre Factor and Level”)
  • gc$history = factor(gc$history, levels=c(“A30”, “A31”, “A32”, “A33”, “A34”))
  • levels(gc$history)=c(“good-others”, “good-thisBank”, “current-paid-duly”, “bad-delayed”, “critical”)
  • summary(gc$history)
  • plot(gc$history, col=”green”, xlab=”History Categorical Variable Post Factor and Level”)

Figure 1. Pre and Post Factor and Level of History Categorical Variable.

  • ##### purpose pre and post factor and level
  • summary(gc$purpose)
  • plot(gc$purpose, col=”darkgreen”)
  • ###tranform purpose
  • gc$purpose <- factor(gc$purpose, levels=c(“A40″,”A41″,”A42″,”A43″,”A44″,”A45″,”A46″,”A48″,”A49″,”A410”))
  • levels(gc$purpose) <- c(“newcar”,”usedcar”,”furniture/equipment”,”radio/television”,”domestic appliances”,”repairs”, “edu”,”vacation-doesNotExist”, “retraining”, “business”, “others”)
  • summary(gc$purpose)
  • plot(gc$purpose, col=”darkgreen”)

Figure 2. Pre and Post Factor and Level of Purpose Categorical Variable.

  • ### housing categorical variable pre and post factor and level.
  • summary(gc$housing)
  • gc$rent <- factor(gc$housing==”A151″)
  • summary(gc$rent)
  • ##### housing categorical variable pre and post factor and level
  • summary(gc$housing)
  • plot(gc$housing, col=”orange”)
  • gc$housing <- factor(gc$housing, levels=c(“A151”, “A152”, “A153”))
  • levels(gc$housing) <- c(“rent”,”own”,”for free”)
  • summary(gc$housing)

Figure 3. Pre and Post Factor and Level of Housing Categorical Variable.

 Task-4:  Summary & Plot the Numerical Variables: Duration, Amount, Installment, & Age.

            The purpose of this task is to obtain the summary of the numerical variables: duration, amount, installment and age and plot the result.

  • ##summary and plot of those numerical variables
  • summary(gc$duration)

Figure 4. Duration Plot as a Numerical and Continous Variable.

  • summary(gc$amount)
  • plot(gc$amount, col=”blue”, main=”Amount Numerical Variable”)

Figure 5. Amount Plot as a Numerical and Continous Variable.

  • summary(gc$installment)
  • plot(gc$installment, col=”blue”, main=”Installment Numerical Variable”)

Figure 6. Installment Plot as a Numerical and Continous Variable.

  • summary(gc$age)
  • plot(gc$age, col=”blue”, main=”Age Numerical Variable”)

Figure 7.  Age Plot as a Numerical and Continous Variable.

Task-5:  Classify the Amount into Groups

            The purpose of this task is to classify the amount into groups as shown below.

  • #### To classify the amount into groups
  • gc$amount <-as.factor(ifelse(gc$amount <=2500, ‘0-2500′, ifelse(gc.df$amount<=5000,’2600-5000’, ‘5000+’)))
  • summary(gc$amount)

Task-6:  Summary of all variables

The purpose of this task is to obtain the result of all required variables.

  • summary(gc$duration)
  • summary(gc$amount)
  • summary(gc$installment)
  • summary(gc$age)
  • summary(gc$history)
  • summary(gc$purpose)
  • summary(gc$housing)
  • summary(gc$rent)

Part-II: Plots, Discussion and Analysis

Task-1:  Select and Plot specific variables for this project

            The purpose of this task is to select the specific required variable and plot them into one single diagram.

  • ##for demonstration, cut the dataset to these selected variables
  • ##(duration, amount, installment, and age) which are numeric and
  • ##(history, purpose and housing) which are categorical and
  • ## Default (representing the risk) which is binary.
  • gc.sv <- gc[,c(“Default”, “duration”, “amount”, “installment”, “age”, “history”, “purpose”, “foreign”, “housing”)]
  • gc.sv[1:3,]
  • summary(gc.sv)
  • plot(gc.sv, col=”red”)
  • ### Setting the Rent
  • gc$rent <- factor(gc$housing==”A151″)
  • summary(gc$rent)

Figure 8.  Plot of all Selected Variables.

Task-2: Model-1: Linear Regression – single variable, and Diagnostic Analysis

                The purpose of this task is to implement Model-1 for Linear Regression using one variable (History) as a factor for the Default.

  • # to get a plot of the Default as dependent and history as independent
  • plot(Default~history, data=gc, col=”darkred”)
  • ##calculate the mean first – but no mean because of NA
  • mean(gc$Default)
  • # to check the NA values
  • gc$Default
  • ##we have to remove null values
  • mean(gc$Default, na.rm=T)
  • ##get the mean without NA values
  • mean.Default=mean(gc$Default,na.rm=T)
  • ## plot again after removing the NA value
  • plot(Default~history, data=gc, col=”darkred”, main=”Default and History Effect”)
  • #put horizontal line at the mean
  • abline(h=mean.Default)
  • #use lm to fit a regression line through these data:
  • model1.Default.history = lm(Default ~ history, data=gc)
  • model1.Default.history
  • abline(model1.Default.history, col=”yellow”)
  • plot(model1.Default.history)
  • # to see the effect of solar
  • termplot(model1.Default.history)
  • #summary
  • summary(model1.Default.history)

Figure 9.  Model-1: Linear Regression Using the Mean Line (black).

Figure 10.  Model-1: Linear Regression Using Regression Line (yellow).

Figure 11.  Model-1: Four Diagnostic Plots For Standard Linear Regression.

Task-3: Model-2: Multiple Regressions Analysis

            The purpose of this task is to implement Model-2 for Multiple Regressions including the Purpose, History, Installment, Housing, Amount, Duration, Age which can influence the Default as dependent variable.

  • #Find relationship between multiple variables
  • ##purpose on Default conditioned with history.
  • coplot(Default~purpose|history, panel=panel.smooth, gc)  
  • ##rent on Default conditioned with history.
  • coplot(Default~rent|history, panel=panel.smooth, gc)  
  • ##housing on Default conditioned with history.
  • coplot(Default~housing|history, panel=panel.smooth, gc)  

Figure 12.  Model-2: Multiple Linear Regression Using Purpose, Housing, Rent, conditioned with History as factors influencing Default.

  • ##amount on Default conditioned with duration.
  • coplot(Default~amount|duration, panel=panel.smooth, gc)  
  • ##installment on Default conditioned with duration.
  • coplot(Default~installment|duration, panel=panel.smooth, gc)
  • ##age on Default conditioned with duration.
  • coplot(Default~age|duration, panel=panel.smooth, gc)  

Figure 13.  Model-2: Multiple Linear Regression Using Amount, Duration as Factors influencing Default.

Task-3: Model-3:  Logistic Regression Analysis

            The purpose of this task is to implement the Logistic Regression Analysis.

  • summary(gc)
  • ###Create a Design Matrix
  • ##Factor variables are turned into indicator variables
  • ##The first column of ones is ommitted
  • Xgc <- model.matrix(Default~.,data=gc)[,-1]
  • Xgc[1:3,]
  • ## Create training and prediction datasets
  • ## Select 900 rows for estimation and 100 for testing
  • set.seed(1)
  • train <- sample(1:1000,900)
  • xtrain <- Xgc[train,]
  • xnew <- Xgc[-train,]
  • ytrain <- gc$Default[train]
  • ynew <- gc$Default[-train]
  • gcglm=glm(Default~.,family=binomial,data=data.frame(Default=ytrain,xtrain))
  • summary(gcglm)
  • plot(gcglm, col=”blue”)
  • coef(gcglm)

Figure 14.  Model-3: Logistic Regression: Diagnostic Analysis: Residuals v. Fitted.

Figure 15.  Model-3: Logistic Regression: Diagnostic Analysis: Normal Q-Q.

Figure 16.  Model-3: Logistic Regression: Diagnostic Analysis: Scale-Location.

Figure 17.  Model-3: Logistic Regression: Diagnostic Analysis: Residuals vs. Leverage.

  • ## Now to prediction: what are the underlying default probabilities
  • ## for cases in the test set
  • ptest <- predict(gcglm, newdata=data.frame(xnew),type=”response”)
  • data.frame(ynew,ptest)
  • ## Using probability cutoff 1/6
  • ## coding as 1 (predicting default) if probability 1/6 or larger
  • probability.one.sixth=floor(ptest+(5/6))
  • probability1=table(ynew,probability.one.sixth)
  • probability1
  • error=(probability1[1,2]+probability1[2,1])/100
  • error
  • ### Binary Classification, Using Probabiillties to make decision, sensitivity and specificity,
  • ### Cut 1/6
  • cut=1/6
  • true.positive <- ynew==1 & ptest >= cut
  • true.positive
  • true.negative <- ynew==0 & ptest < cut
  • true.negative
  • # Sensitivity (predict default when it does happen)
  • sum(true.positive)/sum(ynew==1)
  • # Specificity (predict no default when it does not happen)
  • sum(true.negative)/sum(ynew==0)
  • ## Using probability cutoff 1/2
  • ## coding as 1 if probability 1/2 or larger
  • cut=1/2
  • probability.half=floor(ptest+(1/2))
  • probability2=table(ynew,probability.half)
  • probability2
  • error=(probability2[1,2]+probability2[2,1])/100
  • error
  • true.positive <- ynew==1 & ptest >=cut
  • true.negative <- ynew==0 & ptest < cut
  • # Sensitivity (predict default when it does happen)
  • sum(true.positive)/sum(ynew==1)
  • # Specificity (predict no default when it does not happen)
  • sum(true.negative)/sum(ynew==0)
  • ## R macro for plotting the ROC curve
  • ## plot the ROC curve for classification of y with p
  • roc <- function(p,y){
  • y <- factor(y)
  • n <- length(p)
  • p <- as.vector(p)
  • Q <- p > matrix(rep(seq(0,1,length=500),n),ncol=500,byrow=TRUE)
  • fp <- colSums((y==levels(y)[1])*Q)/sum(y==levels(y)[1])
  • tp <- colSums((y==levels(y)[2])*Q)/sum(y==levels(y)[2])
  • plot(fp, tp, xlab=”1-Specificity”, ylab=”Sensitivity”)
  • abline(a=0,b=1,lty=2,col=8)
  • }
  • ###### ROC for hold-out period
  • roc(p=ptest,y=ynew)
  • ## ROC for all cases (in-sample)
  • gcglmall <- glm(gc$Default ~ Xgc,family=binomial)
  • roc(p=gcglmall$fitted, y=gcglmall$y)
  • ## using the ROCR package to graph the ROC curves
  • library(ROCR)

Figure 18.  Model-3: Logistic Regression: Sensitivity and Specificity for a sample of the data.

Figure 19.  Model-3: Logistic Regression: Sensitivity and Specificity for All the data.

  • ## input is a data frame consisting of two columns
  • ## predictions in first column and actual outcomes in the second
  • ## ROC for hold-out period
  • predictions=ptest
  • labels=ynew
  • data=data.frame(predictions,labels)
  • data
  • ## prediction1: function to create prediction objects
  • prediction1 <- prediction(data$predictions,data$labels)
  • prediction1
  • ## perf: creates the input to be plotted
  • ## sensitivity and one minus specificity (the false positive rate)
  • performance <- performance(prediction1, “sens”, “fpr”)
  • performance
  • plot(performance)

Figure 20.  Model-3: Logistic Regression: ROC for specifc cases.

  • ## ROC for all cases (in-sample)
  • gcglmall <- glm(gc$Default ~ Xgc,family=binomial)
  • predictions=gcglmall$fitted
  • labels=gcglmall$y
  • data=data.frame(predictions,labels)
  • prediction2 <- prediction(data$predictions,data$labels)
  • performance2 <- performance(prediction2, “sens”, “fpr”)
  • plot(performance2)

Figure 21.  Model-3: Logistic Regression: ROC for all cases.

Task-4:  Discussion and Analysis

The descriptive analysis of the history (Figure 1) shows that the existing credits paid back duly till now are ranked number one of 530, followed by the critical account of 293, followed by the category of delay in paying off in the past of 88.  The category of all credits at this bank paid back duly include only 49 and no credits taken or all credits paid back duly has only 40.  The descriptive analysis of the purpose (Figure 2) shows that the radio/TV of 280 ranks number one in the loan, followed by the new car category of 234, followed by the furniture/equipment of 181, and used car of103.  The business and education have 97 and 50 respectively, while the repairs, appliances, retaining and others have the least rank for loans. The descriptive analysis of the housing (Figure 3) shows that the own (Own=713) ranks number one for those who receive loans, followed by the rent (Rent=179).  The category of “free” housing (Free=108) ranks the last for receiving loans.  The descriptive analysis of the duration (Figure 4) shows that the duration average (Mean=21) is higher than the Median duration in a month (Median=18), indicating a positively skewed distribution.  The maximum duration has the value of 72 months, while the minimum duration for the loan is four months.  Most of the duration periods are up to 60 months.  There is an outlier of the duration period of ~70 months as illustrated in Figure 4.  The descriptive analysis of the amount (Figure 5) shows that the average amount of the loan (Mean=3271), is higher than the Median amount of the loan (Median=2320) indicating a positively skewed distribution.  The maximum amount for a loan is 18424, while the minimum amount is 250.  Most loans have the amount of ~5000, followed by the amount of 10,000-15,000.  There is an outlier of a loan amount above 15,000 as illustrated in Figure 5.  The descriptive analysis of the installment (Figure 6) shows that average installment (Mean=2.98) is higher than the Median installment (Median=1.00) indicating a positively skewed distribution.  The maximum installment rate is 4.00, while the minimum installment has a rate of 1.00.  The installment rates as illustrated in (Figure 6) are categorized between 1.00, 2.00, 3.00 and 4.00. The descriptive analysis of the age (Figure 7) shows that the average age (Mean=36) which is higher than the Median age (Median=33) indicating a positively skewed distribution.  The maximum age is 75, while the minimum age is 19.  As illustrated in Figure 7, most of the age is from ~20 to 50, with few densities from 50 to 60 and the fewest density is above 60 and 70.  

The Linear Regression is the first model (Model-1) is implemented on the (history) explanatory variable over the default.  The mean (Mean=3) is plotted in Figure 9 of the Linear Regression of history over the default.  Another line is plotted in Figure 10 is illustrated the Linear Regression using the Regression Line.  The result shows that there is a negative relationship between the Default (success) and the history.  The bad history shows the success in defaulting on a loan. The diagnostic plots of the standard regression are also discussed in this project. Figure 11 illustrates four different diagnostic plots of the standard regression. This analysis also covers the residuals and fitted lines.  Figure 11 illustrated the Residuals vs. Fitted in Linear Regression Model for the History explanatory variable as a function of the Default.  The residuals depict the difference between the actual value of the response variable and the response variable predicted using the regression equation (Hodeghatta & Nayak, 2016). The principle behind the regression line and the regression equation is to reduce the error or this difference (Hodeghatta & Nayak, 2016).  The expectation is that the median value should be near zero (Hodeghatta & Nayak, 2016).  For the model to pass the test of linearity, no pattern in the distribution of the residuals should exist (Hodeghatta & Nayak, 2016).  Where there is no pattern in the distribution of the residuals, it passes the condition of linearity (Hodeghatta & Nayak, 2016). The plot of the fitted values against the residuals with the line shows the relationship between the two. The horizontal and straight line indicates that the “average residual” for all “fitted values” it is more or less the same (Navarro, 2015).  The result of the Linear Regression for the identified variables of History and Default shows that the residual has a curved pattern, indicating that a better model can be obtained using the quadratic term because ideally, this line should be a straight horizontal line.  Figure 11 also illustrates the Normal QQ plot, which is used to test the normality of the distribution (Hodeghatta & Nayak, 2016).  The residuals are not on the straight line, indicating that the residuals are not normally distributed. Hence, the normality test of the residuals did not pass, as it is supposed to be a straight line for the residuals to pass.  Figure 11 also illustrates the Scale-Location graph, which is one of the graphs generated as part of the plot. The points are spread in a random fashion around the horizontal line but not equally the line.  If the horizontal line with equally randomly spread points, the result could indicate that the assumption of constant variance of the errors or homoscedasticity is fulfilled (Hodeghatta & Nayak, 2016).  Thus, it is not fulfilled in this case.  Figure 11 also illustrates the Residuals vs. Leverage Plot generated for the Linear Regression Model. In this plot of Residuals vs. Leverage, the patterns are not as relevant as the case with the diagnostics plot of the Linear Regression. In this plot, the outlying values at the upper right corner or the lower right are watched (Bommae, 2015).  Those spots are the places where a case can be influential against a regression line (Bommae, 2015).  When cases are outside of the Cook’s distance, meaning they have high Cook’s distance scores, the cases are influential to the regression results (Bommae, 2015).  The Cook’s distance lines are (red dashed line) are far indicating there is no influential case.

The Multiple Linear Regression is the second Model.  Multiple variables such as purpose conditioned with history, rent conditioned with history, housing conditioned with history are used to implement the Multiple Regression models.  There are two most noticeable results (Figure 12).  The first noticeable result shows that the category of “good to other banks” that the default as success goes down when the loans are made for (purpose) of new car, furniture, radio/TV, domestic appliances, and repair, while the default as success goes up – meaning failure to default) with education, retraining, business and others.  The second noticeable result is illustrated in the category of “currently paid duly,” that the default as success goes down meaning the loan receiver default on the loan when the loan is made to the same categories as the first noticeable result, but until radio/TV, after which the default on loan will fail for (purpose) of domestic appliances, repair, education, retraining, business, and others.   The other Multiple Regression used the rent and free, the history shows a failure to default for the “good to others” category, while the own category shows success to default for the “current paid duly” category.   For the rent specific, the result shows that these specific categories, there no default on loan with the rent on both categories.  For the amount, installment and age conditioned with duration Multiple Regression models, the result shows that the loan 5000+, when the duration increases, the default failure increases, and when the duration decreases, the default failure decreases meaning there is a significant chance for defaulting on the loan. The same pattern shows when the installment increases, the default on a loan decreases.  The same pattern is also shown for the age, when the age increases, the default on the loan decreases.

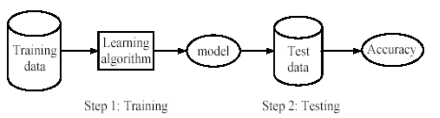
The Logistic Regression Model (Model-3) is the emphasis of this project. The Logistic Regression is used to predict the probability of Default on loan based on other independent variables. In this case, the probability of the Default based on the identified required independent and explanatory variables of duration, amount, installment, age (continuous variables), history, purpose, and rent (categorical variables). 

A random selection of 900 of the 1000 cases is made for the Training set, and the remaining of 100 cases is made into the Test set.  The result shows the coefficient estimates, starting with a negative intercept (slope) of -2.705e-01 with a standard error of 4.833e-01, and the coefficient for each of these identified explanatory variables are also estimated.  The standard error of the coefficient estimates represents the accuracy of the coefficient. The larger the standard error, the less confident about the estimates.  The (z) value represents the z-statistic, which is the coefficient estimate divided by the standard error of the estimates.  The Pr(>|z|) is the last column in the result of the logistic analysis, where the p-value corresponding to the z-statistic.  The smaller the p-value, the more significant the estimates are.  One unit increase in duration (an increase in the number of duration by one) is associated with an increase of logarithm of the odds of the observation being Default.  As indicated in (Fischetti et al., 2017), if the coefficient is positive, it has a positive impact on the probability of the dependent variable, and if the coefficient is negative, it has a negative impact on the probability of the binary outcome (Default).  The age, history with poor and terrible, the purpose for used care, goods or repairs, education, and business, have negative coefficient values indicating that there is a negative impact on the probability of the binary outcome of the Default.  The duration, amount, installment and rent show positive coefficient values indicating that they have a positive impact on the probability of the dependent binary outcome (Default).  As the p-value is much less than 0.05 for duration, amount, installment, history, purpose for used car, goods, repair, and business, and rent, we reject the null hypotheses that there is no significance of the parameter to the model and accept the alternate hypotheses that there is significance of the parameter to the model.  The p-value for the age is (p=0.05) indicating that we accept the null hypothesis that there is no significance of the parameter to the model.  The p-value for (purpose) of education is > 0.05 indicating that we accept the null hypothesis that there is no significance of the parameter to the model.  The performance of the Logistic Regression model for the Test dataset shows that the Logistic Regression recognizes 23 of the 28 Defaults (82%) and predicts the defaults 42 of the 72 good loans (58%).  The coordinates of the sensitivity and specificity (sensitivity = 0.82, 1-specifictiy=0.58) define one point on the ROC curve (Figure 18).  The sensitivity = 8/28=0.29, and specificity =68/72=0.94 for another point on ROC curve (sensitivity = 0.29, 1-specificity=0.06) (Figure 19).  The ROC is calculated using various cutoff on the probability.  The ROC curves that assess the predictive quality of the classification rule on the holdout sample of 100 observations as shown in (Figure 18), and on the complete data set of all 1000 cases as shown in (Figure 19).  Specified values on sensitivity and specificity imply a certain value for the probability cutoff.  However, for certain data and models, no cutoff may achieve the given desires properties on sensitivity and specificity, implying that the desired sensitivity and specificity cannot be attained (Ledolter, 2013).

References

Ahlemeyer-Stubbe, A., & Coleman, S. (2014). A practical guide to data mining for business and industry: John Wiley & Sons.

Bommae, K. (2015). Understanding Diagnostic Plots of Linear Regression Analysis. Retrieved from https://data.library.virginia.edu/diagnostic-plots/.

Fischetti, T., Mayor, E., & Forte, R. M. (2017). R: Predictive Analysis: Packt Publishing.

Hodeghatta, U. R., & Nayak, U. (2016). Business Analytics Using R-A Practical Approach: Springer.

Ledolter, J. (2013). Data mining and business analytics with R: John Wiley & Sons.

Navarro, D. J. (2015). Learning statistics with R: A tutorial for psychology students and other beginners. R package version 0.5.

r-project.org. (2018). R: A Language and Environment for Statistical Computing. Retrieved from https://cran.r-project.org/doc/manuals/r-release/fullrefman.pdf.

Machine Learning: How Logistic Regression Is Used to Predict Categorical Outcome

Dr. O. Aly
Computer Science

Introduction

The purpose of this discussion is to discuss how the Logistic Regression used to predict the categorical outcome.  The discussion addresses the predictive power of categorical predictors of a binary outcome and whether the Logistic Regression should be used.  The discussion begins with an overall overview of variable types, business analytics methods based on data types and by market sector. The discussion then addresses how Logistic Regression is used when working with categorical outcome variable, and it ends with an example of Logistic Regression using R.  

Variables Types

Variables can be classified in various ways.  Variables can be categorical or continuous (Ary, Jacobs, Sorensen, & Walker, 2013).  When researchers classify subjects by sorting them into mutually exclusive groups, the attribute on which they base the classification is termed as a “categorical variables” (Ary et al., 2013).   Examples of categorical variables are home language, county of residence, father’s principal occupation, and school in which enrolled (Ary et al., 2013).  The simplest type of categorical variable has only two mutually exclusive classes and is called a “dichotomous variable” (Ary et al., 2013).  Male-Female, Citizen-Alien, and Pass-Fail are examples of the dichotomous variables (Ary et al., 2013).  Some categorical variables have more than two classes such as educational level, religious affiliation, and state of birth (Ary et al., 2013).  When the attribute has an “infinite” number of values with a range, it is a continuous variable (Ary et al., 2013).  Examples of continuous variables include height, weight, age, and achievement test scores (Ary et al., 2013). 

The most important classification of variables is by their use in the research under consideration when they are classified as independent variables or dependent variables (Ary et al., 2013).  The independent variables are antecedent to dependent variables and are known or are hypothesized to influence the dependent variable which is the outcome (Ary et al., 2013).  In experimental studies, the treatment is the independent variable, and the outcome is the dependent variable (Ary et al., 2013).  In a non-experimental study, it is often more challenging to label variables as independent or dependent (Ary et al., 2013).  The variable that inevitably precedes another one in time is called an independent variable (Ary et al., 2013).  For instance, in a research study of the relationship between teacher experience and students’ achievement scores, teacher experience would be considered as the independent variable (Ary et al., 2013).

Business Analytics Methods Based on Variable Types

The data types play a significant role in the employment of the analytical method.  As indicated in (Hodeghatta & Nayak, 2016), when the response (dependent) variable is continuous, and the predictor variables are either continuous or categorical, the Linear Regression, Neural Network, K-Nearest Neighbor (K-NN) methods can be used as detailed in Table 1. When the response (dependent) variable is categorical, and the predictor variables are either continuous or categorical, the Logistic Regression, K-NN, Neural Network, Decision/Classification Trees, Naïve Bayes can be used as detailed in Table 1.

Table-1: Business Analytics Methods Based on Data Types. Adapted from (Hodeghatta & Nayak, 2016).

Analytics Techniques/Methods Used By Market Sectors

In (EMC, 2015), the Analytic Techniques and Methods used are summarized in Table 2 by some of the Market Sectors.  These are examples of the application of these analytic techniques and method used.  As shown in Table 2, Logistic Regression can be used in Retail Business and Wireless Telecom industries. Additional methods are also used for different Market Sector as shown in Table 2.

Table 2.  Analytic Techniques/Methods Used by Market Sector (EMC, 2015).

Besides the above Market Sectors, Logistic Regression can also be used in Medical, Finance, Marketing and Engineering (EMC, 2015), while the Linear Regression can be used in Real Estate, Demand Forecasting, and Medical (EMC, 2015).

Predicting Categorical Outcomes Using Logistic Regression

The Logistic Regression model was first introduced by Berkson (Colesca, 2009; Wilson & Lorenz, 2015), who showed how the model could be fitted using iteratively reweighted least squares (Colesca, 2009).  Logistic Regression is widely used (Ahlemeyer-Stubbe & Coleman, 2014; Colesca, 2009) in social science research because many studies involve binary response variable (Colesca, 2009). Thus, in Logistic Regression, the target outcome is “binary,” such as YES or NO or the target outcome is categorical with just a few categories (Ahlemeyer-Stubbe & Coleman, 2014), while the Regular Linear Regression is used to model continuous target variables (Ahlemeyer-Stubbe & Coleman, 2014).  Logistic Regression calculates the probability of the outcome occurring, rather than predicting the outcome corresponding to a given set of predictors (Ahlemeyer-Stubbe & Coleman, 2014).  The Logistic Regression can answer questions such as: “What is the probability that an applicant will default on a loan?” while the Linear Regression can answer questions such as “What is a person’s expected income?” (EMC, 2015).  The Logistic Regression is based on the logistic function f(y), as shown in equation (1) (EMC, 2015).  

The expected value of the target variable from a Logistic Regression is between 0 and 1 and can be interpreted as a “likelihood” (Ahlemeyer-Stubbe & Coleman, 2014).  When y à¥, f(y) à1, and when y à¥, f(y) à0.  Figure 1 illustrates an example of the value of the logistic function f(y) varies from 0 to 1 as y increases using the Logistic Regression method (EMC, 2015).

Figure 1.  Logistic Function (EMC, 2015).

Because the range of f(y) is (0,1), the logistic function appears to be an appropriate function to model the probability of a particular outcome occurring (EMC, 2015).  As the value of the (y) increases, the probability of the outcome occurring increases (EMC, 2015).  In any proposed model, (y) needs to be a function of the input variables in any proposed model to predict the likelihood of an outcome (EMC, 2015).  In the Logistic Regression, the (y) is expressed as a linear function of the input variables (EMC, 2015).  The formula of the Logistic Regression is shown in equation (2) below, which is similar to the Linear Regression equation (EMC, 2015).  However, one difference is that the values of (y) are not directly observed, only the value of f(y) regarding success or failure, typically expressed as 1 or 0 respectively is observed (EMC, 2015).

Based on the input variables of x1, x2, …, xp-1, the probability of an event is shown in equation (3) below (EMC, 2015).

Using the (p) to denote f(y), the equation can be re-written as shown in equation (4) (EMC, 2015).  The quantity ln(p/p-1), in the equation (4) is known as the log odds ratio, or the logit of (p) (EMC, 2015).       

The probability is a continuous measurement, but because it is a constrained measurement, and it is bounded by 0 and 1, it cannot be measured using the Regular Linear Regression (Fischetti, 2015), because one of the assumptions in Regular Linear Regression is that all predictor variables must be “quantitative” or “categorical,” and the outcome  variables must be “quantitative,” “continuous” and “unbounded” (Field, 2013). The “quantitative” indicates that they should be measured at the interval level, and the “unbounded” indicates that there should be no constraints on the variability of the outcome (Field, 2013).  In the Regular Linear Regression, the outcome is below 0 and above 1 (Fischetti, 2015). 

The logistic function can be applied to the outcome of a Linear Regression to constrain it to be between 0 and 1, and it can be interpreted as a proper probability (Fischetti, 2015).  As shown in Figure 1, the outcome of the logistic function is always between 0 and 1. Thus, the Linear Regression can be adapted to output probabilities (Fischetti, 2015).  However, the function which can be applied to the linear combination of predictors is called “inverse link function,” while the function that transforms the dependent variable into a value that can be modeled using linear regression is just called “link function” (Fischetti, 2015).  In the Logistic Regression, the “link function” is called “logit function” (Fischetti, 2015).   The transformation logit (p) is used in Logistic Regression with the letter (p) to represent the probability of success (Ahlemeyer-Stubbe & Coleman, 2014).  The logit (p) is a non-linear transformation, and Logistic Regression is a type of non-linear regression (Ahlemeyer-Stubbe & Coleman, 2014).

There are two problems that must be considered when dealing with Logistic Regressions. The first problem is that the ordinary least squares of the Regular Linear Regression to solve for the coefficients cannot be used because the link function is non-linear (Fischetti, 2015).  Most statistical software solves this problem by using a technique called Maximum Likelihood Estimation (MLE) instead (Fischetti, 2015). Techniques such as MLE are used to estimate the model parameters (EMC, 2015). The MLE determines the values of the model parameters which maximize the chances of observing the given dataset (EMC, 2015).  

The second problem is that Linear Regression assumes that the error distribution is normally distributed (Fischetti, 2015).  Logistic Regression models the error distribution as a “Bernoulli” distribution or a “binomial distribution” (Fischetti, 2015).   In the Logistic Regression, the link function and error distributions are the logits and binomial respectively.  In the Regular Linear Regression, the link function is the identity function, which returns its argument unchanged, and the error distribution is the normal distribution (Fischetti, 2015).

Logistic Regression in R

The function glm() is used in R to perform Logistic Regression.  The error distribution and link function will be specified in the “family” argument.  The family argument can be family=”binomial” or family=binomial(). Example of the glm() using the births.df dataset.  In this example, we are building Logistic Regression using all available predictor variables on SEX gender (male, female).

References

Ahlemeyer-Stubbe, A., & Coleman, S. (2014). A practical guide to data mining for business and industry: John Wiley & Sons.

Ary, D., Jacobs, L. C., Sorensen, C. K., & Walker, D. (2013). Introduction to research in education: Cengage Learning.

Colesca, S. E. (2009). Increasing e-trust: A solution to minimize risk in e-government adoption. Journal of applied quantitative methods, 4(1), 31-44.

EMC. (2015). Data Science and Big Data Analytics: Discovering, Analyzing, Visualizing and Presenting Data. (1st ed.): Wiley.

Field, A. (2013). Discovering Statistics using IBM SPSS Statistics: Sage publications.

Fischetti, T. (2015). Data Analysis with R: Packt Publishing Ltd.

Hodeghatta, U. R., & Nayak, U. (2016). Business Analytics Using R-A Practical Approach: Springer.

Wilson, J. R., & Lorenz, K. A. (2015). Short History of the Logistic Regression Model Modeling Binary Correlated Responses using SAS, SPSS and R (pp. 17-23): Springer.

Machine Learning: Logistic Regression

Dr. O. Aly
Computer Science

Introduction

The purpose of this discussion is to discuss and analyze the assumptions of the Logistic Regression, and the assumptions of the Regular Regression, which are not applicable to the Logistic Regression.  The discussion and the analysis also address the type of the variables in both the Logistic Regression and the Regular Regression. 

Regular Linear Regression:

Regression analysis is used when a linear model is fit to the data and is used to predict values of an outcome variable or dependent variable from one or more predictor variable or independent variables (Field, 2013).  The Linear Regression is also defined in (Field, 2013) as a method which is used to predict the values of the continuous variables, and to make inferences about how specific variables are related to a continuous variable.  These two procedures of the prediction and inference rely on the information from the statistical model, which is represented by an equation or series of equations with some number of parameters (Tony Fischetti, 2015).  Linear Regression is the most important prediction method for “continuous” variables (Giudici, 2005). 

With one predictor or independent variable, the technique is sometimes referred to as “Simple Regression” (Field, 2013; Tony Fischetti, 2015; T. Fischetti, Mayor, & Forte, 2017; Giudici, 2005).  However, when there are several predictors or independent variables in the model, it is referred to as “Multiple Regression” (Field, 2013; Tony Fischetti, 2015; T. Fischetti et al., 2017; Giudici, 2005).  In Regression Analysis, the differences between what the model predicts and the observed data are called “Residuals” which are the same as “Deviations” when looking at the Mean (Field, 2013).  These deviations are the vertical distances between what the model predicted and each data point that was observed.  Sometimes, the predicted value of the outcome is less than the actual value, and sometimes it is greater, meaning that the residuals are sometimes positive and sometimes negative.  To evaluate the error in a regression model, like when the fit of the mean using the variance is assessed, a sum of squared errors can be used using residual sum squares (SSR) or the sum of squared residuals (Field, 2013).  This SSR is an indicator of how well a particular line fits the data: if the SSR is large, the line is not representative of the data; if the SSR is small, the line is a representative of the data (Field, 2013).

When using the Simple Linear Regression with the two variables; one independent or predictor and the other is outcome or dependent, the equation is as follows (Field, 2013).

In this Regression Model, the (b) is the correlation coefficient (more often denoted as ( r )), and it is a standardized measure (Field, 2013). However, an unstandardized measure of (b) can be used, but the equation will alter to be as follows (Field, 2013):

This model differs from that of a correlation only in that it uses an unstandardized measure of the relationship (b) and consequently a parameter (b0) for the value of the outcome must be included, when the predictor is zero (Field, 2013).  These parameters of (b0) and (b1) are known as the Regression Coefficients (Field, 2013).

When there are more than two variables which might be related to the outcome, Multiple Regression can be used. The Multiple Regression can be used with three, four or more predictors (Field, 2013).  The equation for the Multiple Regression is as follows:

The (b1) is the coefficient of the first predictor (X1), (b2) is the second coefficient of the second predictor (X2), and so forth, as (bn) is the coefficient of the nth predictor (Xni) (Field, 2013). 

To assess the goodness of fit for the Regular Regression, the sum of squares, the R and R2 can be used.  When using the Mean as a model, the difference between the observed values and the values predicted by the mean can be calculated using the sum of squares (denoted SST) (Field, 2013).  This value of the SST represents how good the Mean is as a model of the observed data (Field, 2013).  When using the Regression Model, the SSR can be used to represent the degree of inaccuracy when the best model is fitted to the data (Field, 2013). 

Moreover, these two sums of squares of SST and SSR can be used to calculate how much better the regression model is than using a baseline model such as the Mean model (Field, 2013).  The improvement in prediction resulting from using the Regression Model rather than the Mean Model is measured by calculating the difference between SST and SSR (Field, 2013).  Such improvement is the Model Sum of Squares (SSM) (Field, 2013).  If the value of SSM is large, then the regression model is very different from using the mean to predict the outcome variable, indicating that the Regression Model has made a big improvement to how well the outcome variable can be predicted (Field, 2013). However, if the SSM is small then using the Regression Model is a little better than using the Mean model (Field, 2013).  Calculating the R2 by dividing SSM by SST to measure the proportion of the improvement due to the model.  The R2 represents the amount of variance in the outcome explained by the mode (SSM) relative to how much variation there was to explain in the first place (SST) (Field, 2013).  Other methods to assess the goodness-of-fit of the Model include the F-test using Mean Squares (MS) (Field, 2013), and F-statistics to calculate the significance of R2(Field, 2013). To measure the individual contribution of a predictor in Regular Linear Regression, the estimated regression coefficient (b) and their standard errors to compute a t-statistic are used (Field, 2013).

The Regression Model must be generalized as a generalization is a critical additional step, because if the model cannot be generalized, then any conclusion must be restricted based on the model to the sample used (Field, 2013).  For the regression model to generalize, cross-validation can be used (Field, 2013; Tony Fischetti, 2015) and the underlying assumptions must be met (Field, 2013).

Central Assumptions of Regular Linear Regression in Order of Importance

The assumptions of the Linear Model in order of importance as indicated in (Field, 2013) are as follows:

  1. Additivity and Linearity:  The outcome variable should be linearly related to any predictors, and with several predictors, their combined effect is best described by adding their effects together. Thus, the relationship between variables is linear.  If this assumption is not met, the model is invalid.  Sometimes, variables can be transformed to make their relationships linear (Field, 2013).
  2. Independent Errors:  The residual terms should be uncorrelated (i.e., independent) for any two observations, sometimes described as “lack of autocorrelation” (Field, 2013).  If this assumption of independence is violated, the confidence intervals and significance tests will be invalid.  However, regarding the model parameters, the estimates using the method of least square will still be valid but not optimal (Field, 2013).  This assumption can be tested with the Durbin-Watson test, which tests for serial correlations between errors, specifically, it tests whether adjacent residuals are correlated (Field, 2013).  The size of the Durbin-Watson statistic depends upon the number of predictors in the model and the number of observation (Field, 2013).  As a very conservative rule of thumb, values less than one or greater than three are the cause of concern; however, values closer to 2 may still be problematic, depending on the sample and model (Field, 2013).
  3. Homoscedasticity:  At each level of the predictor variable(s), the variance of the residual terms should be constant, meaning that the residuals at each level of the predictor(s) should have the same variance (homoscedasticity) (Field, 2013).  When the variances are very unequal there is said to be heteroscedasticity.  Violating this assumption invalidates the confidence intervals and significance tests (Field, 2013). However, estimates of the model parameters (b) using the method of least squares are still valid but not optimal (Field, 2013).  This problem can be overcome by using weighted least squares regression in which each case is weighted by a function of its variance (Field, 2013).
  4. Normally Distributed Errors:   It is assumed that the residuals in the model are random, normally distributed variables with a mean of 0.  This assumption means that the differences between the model and the observed data are most frequently zero or very close to zero, and that differences much greater than zero happen only occasionally (Field, 2013).  This assumption sometimes is confused with the idea that predictors have to be normally distributed (Field, 2013).  Predictors do not need to be normally distributed (Field, 2013). In small samples a lack of normality will invalidate confidence intervals and significance tests; in large samples, it will not, because of the central limit theorem (Field, 2013).  If the concern is only with estimating the model parameters and not with the significance tests and confidence intervals, then this assumption barely matters (Field, 2013).  In other words, this assumption matters for significance tests and confidence intervals.  This assumption can also be ignored if the bootstrap of confidence intervals is used (Field, 2013).

Additional Assumptions of Regular Linear Regression

There are additional assumptions when dealing with Regular Linear Regression.  These additional assumptions are as follows as indicated in (Field, 2013).

  • Predictors are uncorrelated with “External Variable,” or “Third Variable”  External variables are variables which have not been included in the regression model and influence the outcome variable. These variables can be described as “third variable.” This assumption indicates that there should be no external variables that correlate with any of the variables included int eh regression model (Field, 2013).  If external variables do correlate with the predictors, the conclusion that is drawn from the model become “unreliable” because other variables exist that can predict the outcome just as well (Field, 2013).
  • Variable Types: All predictor (independent) variables must be “quantitative” or “categorical,” and the outcome (dependent) variables must be “quantitative,” “continuous” and “unbounded” (Field, 2013). The “quantitative” indicates that they should be measured at the interval level, and the “unbounded” indicates that there should be no constraints on the variability of the outcome (Field, 2013).  
  • No Perfect Multicollinearity: If the model has more than one predictor then there should be no perfect linear relationship between two or more of the predictors.  Thus, the predictors (independent) variables should not correlate too highly (Field, 2013).
  • Non-Zero Variance: The predictors should have some variations in value; meaning they do not have variances of zero (Field, 2013).  

Logistic Regression

When the dataset has categorical variables as well as continuous predictors (independent), Logistic Regression is used (Field, 2013). Logistic Regression is multiple regression but with an outcome (dependent) variable that is categorical and predictor variables that are continuous or categorical.  Logistic Regression is the main prediction method for qualitative variables (Giudici, 2005).

Logistic Regression can have life-saving applications as in medical research it is used to generate models from which predictions can be made about the “likelihood” that, e.g. a tumor is cancerous or benign (Field, 2013). A database is used to develop which variables are influential in predicting the “likelihood” of malignancy of a tumor (Field, 2013). These variables can be measured for a new patient and their values placed in a Logistic Regression model, from which a “probability” of malignancy could be estimated (Field, 2013).  Logistic Regression calculates the “probability” of the outcome occurring rather than making a prediction of the outcome corresponding to a given set of predictors (Ahlemeyer-Stubbe & Coleman, 2014). The expected values of the target variable from a Logistic Regression are between 0 and 1 and can be interpreted as a “likelihood” (Ahlemeyer-Stubbe & Coleman, 2014).

There are two types of Logistic Regression; Binary Logistic Regression, and Multinomial or Polychotomous Logistic Regression.  The Binary Logistic Regression is used to predict membership of only two categorical outcomes or dependent variables, while the Multinomial or Polychotomous Logistic Regression is used to predict membership of more than two categorical outcomes or dependent variables (Field, 2013).

Concerning the assessment of the model, the R-statistics can be used to calculate a more literal version of the multiple correlations in the Logistic Regression model.  The R-statistic is the partial correlation between the outcome variable and each of the predictor variables, and it can vary between -1 and +1. A positive value indicates that as the predictor variable increases, so does the likelihood of the event occurring, while the negative value indicates that as the predictor variable increases, the likelihood of the outcome occurring decreases (Field, 2013).  If a variable has a small value of R then, it contributes a small amount to the model.  Other measures for such assessment include Hosmer and Lemeshow, Cox and Snell’s and Nagelkerke’s (Field, 2013). All these measures differ in their computation, conceptually they are somewhat the same, and they can be seen as similar to the R2 in linear regression regarding interpretation as they provide a gauge of the substantive significance of the model (Field, 2013).

In the Logistic Regression, there is an analogous statistics, the z-statistics, which follows the normal distribution to measure the individual contribution of predictors (Field, 2013). Like the t-tests in the Regular Linear Regression, the z-statistic indicates whether the (b) coefficient for that predictor is significantly different from zero (Field, 2013). If the coefficient is significantly different from zero, then the assumption can be that the predictor is making a significant contribution to the prediction of the outcome (Y) (Field, 2013). The z-statistic is known as the Wald statistic as it was developed by Abraham Wald (Field, 2013).  

Principles of Logistic Regression

One of the assumptions mentioned above for the regular linear models is that the relationship between variables is linear for the linear regression to be valid.  However, when the outcome variable is categorical, this assumption is violated as explained in the “Variable Types” assumption above, because and the outcome (dependent) variables must be “quantitative,” “continues” and “unbounded” (Field, 2013).  To get around this problem, the data must be transformed using the logarithmic transformation).  The purpose of this transformation is to express the non-linear relationship into a linear relationship (Field, 2013). However, Logistic Regression is based on this principle as it expresses the multiple linear regression equation in logarithmic terms called the “logit” and thus overcomes the problem of violating the assumption of linearity (Field, 2013).  The transformation logit (p) is used in Logistic Regression with the letter (p) representing the probability of success (Ahlemeyer-Stubbe & Coleman, 2014).  The logit (p) is a non-linear transformation, and Logistic Regression is a type of non-linear regression (Ahlemeyer-Stubbe & Coleman, 2014).

Assumptions of the Logistic Regression

In the Logistic Regression, the assumptions of the ordinary regression are still applicable.  However, the following two assumptions are dealt with differently in the Logistic Regression (Field, 2013):

  • Linearity:  While in the ordinary regression, the assumption is that the outcome has a linear relationship with the predictors, in the logistic regression, the outcome is categorical, and so this assumption is violated, and the log (or logit) of the data is used to overcome this violation (Field, 2013). Thus, the assumption of linearity in Logistic Regression is that there is a linear relationship between any continuous predictors and the logit of the outcome variable (Field, 2013). This assumption can be tested by checking if the interaction term between the predictor and its log transformation is significant (Field, 2013).  In short, the linearity assumption is that each predictor has a linear relationship with the log of the outcome variable when using the Logistic Regression.
  • Independence of Errors:  In the Logistic Regression, violating this assumption produces overdispersion, which can occur when the observed variance is bigger than expected from the Logistic Regression model.   The overdispersion can occur for two reasons (Field, 2013). The first reason is the correlated observation when the assumption of independence is broken (Field, 2013). The second reason is due to variability in success probabilities (Field, 2013). The overdispersion tends to limit standard errors, which creates two problems. The first problem is the test statistics of regression parameters which are computed by dividing by the standard error, so if the standard error is too small, then the test statistic will be too big and falsely deemed significant.  The second problem is the confidence intervals which are computed from standard errors, so if the standard error is too small, then the confidence interval will be too narrow and result in the overconfidence about the likely relationship between predictors and the outcome in the population. In short, the overdispersion occurs when the variance is larger than the expected variance from the model.  This overdispersion can be caused by violating the assumption of independence.  This problem makes the standard errors too small (Field, 2013), which can bias the conclusions about the significance of the model parameters (b-values) and population value (Field, 2013).

Business Analytics Methods Based on Data Types

In (Hodeghatta & Nayak, 2016), the following table summarizes the business analytics methods based on the data types.  As shown in the table, when the response (dependent) variable is continuous, and the predictor variables is either continuous or categorical, the Linear Regression method is used.  When the response (dependent) variable is categorical, and the predictor variables are either continuous or categorical, the Logistic Regression is used.  Other methods are also listed as additional information.

Table-1. Business Analytics Methods Based on Data Types. Adapted from (Hodeghatta & Nayak, 2016).

References

Ahlemeyer-Stubbe, A., & Coleman, S. (2014). A practical guide to data mining for business and industry: John Wiley & Sons.

Field, A. (2013). Discovering Statistics using IBM SPSS Statistics: Sage publications.

Fischetti, T. (2015). Data Analysis with R: Packt Publishing Ltd.

Fischetti, T., Mayor, E., & Forte, R. M. (2017). R: Predictive Analysis: Packt Publishing.

Giudici, P. (2005). Applied data mining: statistical methods for business and industry: John Wiley & Sons.

Hodeghatta, U. R., & Nayak, U. (2016). Business Analytics Using R-A Practical Approach: Springer.

Overfitting and Parsimony in Large Dataset Analysis

Dr. O. Aly
Computer Science

Introduction:  The purpose of this discussion is to discuss the issues of overfitting versus using parsimony and their importance in Big Data analysis.  The discussion also addresses if the overfitting approach is a problem in the General Least Square Model (GLM) approach.  Some hierarchical methods which do not require parsimony of GLM are also discussed in this discussion. This discussion does not include the GLM as it was discussed earlier. It begins with Parsimony in Statistics model.

Parsimony Principle in Statistical Model

The medieval (14th century) English philosopher, William of Ockham (1285 – 1347/49) (Forster, 1998) popularized a critical principle stated by Aristotle “Entities must not be multiplied beyond what is necessary” (Bordens & Abbott, 2008; Epstein, 1984; Forster, 1998).  The refinement of this principle by Ockham is now called “Occam’s Razor” stating that a problem should be stated in the simplest possible terms and explained with the fewest postulates possible (Bordens & Abbott, 2008; Epstein, 1984; Field, 2013; Forster, 1998).  This method is now known as Law or Principle of Parsimony (Bordens & Abbott, 2008; Epstein, 1984; Field, 2013; Forster, 1998).  Thus, based on this law, a theory should account for phenomena within its domain in the simplest terms possible and with the fewest assumptions (Bordens & Abbott, 2008; Epstein, 1984; Field, 2013; Forster, 1998).  As indicated by (Bordens & Abbott, 2008), if there are two competing theories concerning a behavior, the one which explains the behavior in the simplest terms is preferred under the law of parsimony. 

Modern theories of the attribution process, development, memory, and motivation adhere to this law of parsimony (Bordens & Abbott, 2008).  However, the history of science witnessed some theories which got crushed under their weight of complexity (Bordens & Abbott, 2008). For instance, the collapse of interest in the Hull-Spence model of learning occurred primarily because the theory had been modified so many times to account for anomalous data that was no longer parsimonious (Bordens & Abbott, 2008).  The model of Hull-Spence became too complicated with too many assumptions and too many variables whose values had to be extracted from the very data that the theory was meant to explain (Bordens & Abbott, 2008).  As a result of such complexity, the interest in the theory collapsed and got lost.  The Ptolemaic Theory of planetary motion also lost its parsimony because it lost much of its true predictive power (Bordens & Abbott, 2008).

Parsimonious is one of the characteristics of a good theory (Bordens & Abbott, 2008).  Parsimonious explanation or a theory explains a relationship using relatively few assumptions (Bordens & Abbott, 2008). When more than one explanation is offered for observed behavior, scientists and researchers prefer the parsimonious explanation which explains behavior with the fewest number of assumptions (Bordens & Abbott, 2008). Scientific explanations are regularly evaluated and examined for consistency with the evidence and with known principles for parsimony and generality (Bordens & Abbott, 2008).  Accepted explanations can be overthrown in favor of views which are more general, more parsimonious, and more consistent with observation (Bordens & Abbott, 2008).

How to Develop Fit Model Using Parsimony Principle

When building a model, the researcher should strive for parsimony  (Bordens & Abbott, 2008; Field, 2013). The statistical implication of using a parsimony heuristic is that models be kept as simple as possible, meaning predictors should not be included unless they have the explanatory benefit (Field, 2013).  This strategy can be implemented by fitting the model that include all potential predictors, and then systematically removing any that do not seem to contribute to the model (Field, 2013).  Moreover, if the model includes interaction terms, then, the interaction terms to be valid, the main effects involved in the interaction term should be retained (Field, 2013).  Example of the implementation of Parsimony in developing a model include three variables in a patient dataset: (1) outcome variable (as cured or not cured), which is dependent variable (DV), (2) intervention variable, which is a predictor independent variable (IV), and (3) duration, which is another predictor independent variable (Field, 2013).  Thus, the three potential predictors can be Intervention, Duration and the interaction of the “Intervention x Duration” (Field, 2013).  The most complex model includes all of these three predictors.  As the model is being developed, any terms that are added but did not improve the model should be removed and adopt the model which did not include those terms that did not make a difference.  Thus, the first model (model-1) which the researchers can fit would be to have only Intervention as a predictor (Field, 2013).  Then, the model is built up by adding in another main effect of the Duration in this example as model-2.  The interaction of the Intervention x Duration can be added in model-3. Figure 1 illustrates these three models of development. The goal is to determine which of these models best fits the data while adhering to the general idea of parsimony (Field, 2013).   If the interaction term model-3 did not improve the model (model-2), then model-2 should be used as the final model.  If the Duration in model-2 did not make any difference and did not improve model-1, then model-1 should be used as the final model (Field, 2013).  The aim is to build the model systematically and choose the most parsimonious model as the final model.  The parsimonious representations are essential because simpler models tend to give more insight into a problem (Ledolter, 2013). 

Figure 1.  Building Models based on the Principle of Parsimony (Field, 2013).

Overfitting in Statistical Models

Overfitting is a term used when using models or procedures which violate Parsimony Principle, it means that the model includes more terms than are necessary or uses more complicated approaches than necessary (Hawkins, 2004).   There are two types of “Overfitting” methods.  The first “Overfitting” method is to use a model which is more flexible than it needs to be (Hawkins, 2004).  For instance, a neural net can accommodate some curvilinear relationships and so is more flexible than a simple linear regression (Hawkins, 2004). However, if it is used on a dataset that conforms to the linear model, it will add a level of complexity without any corresponding benefit in performance, or even worse, with poorer performance than the simpler model (Hawkins, 2004).  The second “Overfitting” method is to use a model that includes irrelevant components such as a polynomial of excessive degree or a multiple linear regression that has irrelevant as well as the needed predictors (Hawkins, 2004). 

The “Overfitting” technique is not preferred for four essential reasons (Hawkins, 2004).  The first reason involves wasting resources and expanding the possibilities for undetected errors in databases which can lead to prediction mistakes, as the values of these unuseful predictors must be substituted in the future use of the mode (Hawkins, 2004).  The second reason is that the model with unneeded predictors can lead to worse decisions (Hawkins, 2004).   The third reason is that irrelevant predictor can make predictions worse because the coefficients fitted to them add random variation to the subsequent predictions (Hawkins, 2004). The last reason is that the choice of model has an impact on its portability (Hawkins, 2004). The one-predictor linear regression that captures a relationship with the model is highly portable (Hawkins, 2004).  The more portable model is preferred over, the less portable model, as the fundamental requirement of science is that one researcher’s results can be duplicated by another researcher (Hawkins, 2004). 

Moreover, large models overfitted on training dataset turn out to be extremely poor predictors in new situations as needed predictor variables increase the prediction error variance (Ledolter, 2013).  The overparameterized models are of little use if it is difficult to collect data on predictor variables in the future.  The partitioning of the data into training and evaluation (test) datasets is central to most data mining methods (Ledolter, 2013). Researchers must check whether the relationships found in the training dataset will hold up in the future (Ledolter, 2013).

How to recognize and avoid Overfit Models

A model overfits if it is more complicated than another model that fits equally well (Hawkins, 2004).  The recognition of overfitting model involves not only the comparison of the simpler model and the more complex model but also the issue of how the fit of a model is measured (Hawkins, 2004).  Cross-Validation can detect overfit models by determining how well the model generalizes to other datasets by partitioning the data (minitab.com, 2015).  This process of cross-validation helps assess how well the model fits new observations which were not used in the model estimation process (minitab.com, 2015). 

Hierarchical Methods

The regression analysis types include simple, hierarchical, and stepwise analysis (Bordens & Abbott, 2008).  The main difference between these types is how predictor variables are entered into the regression equation which may affect the regression solution (Bordens & Abbott, 2008).  In the simple regression analysis, all predictors variables are entered together, while in the hierarchical regression, the order in which variables are entered into the regression equation is specified (Bordens & Abbott, 2008; Field, 2013).  Thus, the hierarchical regression is used for a well-developed theory or model suggesting a specific causal order (Bordens & Abbott, 2008). As a general rule, known predictors should be entered into the model first in order of their importance in predicting the outcome (Field, 2013).  After the known predictors have been entered, any new predictors can be added into the model (Field, 2013).  In the stepwise regression, the order in which variables are entered is based on a statistical decision, not on a theory (Bordens & Abbott, 2008).  

The choice of the regression analysis should be based on the research questions or the underlying theory (Bordens & Abbott, 2008).  If the theoretical model is suggesting a particular order of entry, the hierarchical regression should be used (Bordens & Abbott, 2008). Stepwise regression is infrequently used because sampling and measurement error tends to make unstable correlations among variables in stepwise regression (Bordens & Abbott, 2008).  The main problem with the stepwise methods is that they assess the fit of a variable based on the other variables in the model (Field, 2013).

Goodness-of-fit Measure for the Fit Model

Comparison between hierarchical and stepwise methods:  The hierarchical and stepwise methods involve adding predictors to the model in stages, and it is useful to know these additions improve the model (Field, 2013).  Since the larger values of R2 indicates better fit, thus, a simple way to see whether a model has improved as a result of adding predictors to it would be to see whether R2 for the new model is bigger than for the old model.  However, it will always get bigger if predictors are added, so the issue is more whether it gets significantly bigger (Field, 2013).  The significance of the change in R2 can be assessed using the equation below as the F-statistics is also be used to calculate the significance of R2 (Field, 2013) 

However, because the focus is on the change in the models, thus the change in R2  (R2 change)  and R2 of the newer model (R2 new) are used using the following equation (Field, 2013). Thus, models can be compared using this F-ratio (Field, 2013). 

The Akaike’s Information Criterion (AIC) method is a goodness-of-fit measure which penalizes the model for having more variables. If the AIC is bigger, the fit is worse; if the AIC is smaller, the fit is better (Field, 2013).   If the Automated Linear Model function in SPSS is used, then AIC is used to select models rather than the change in R2. AIC is used to compare it with other models with the same outcome variables; if it is getting smaller, then the fit of the model is improving (Field, 2013).  In addition to the AIC method, there is Hurvich and Tsai’s criterion (AICC), which is a version of AIC designed for small samples (Field, 2013).  Bozdogan’s criterion (CAIC), which is a version of AIC which is used for model complexity and sample size. Bayesian Information Criterion (BIC) of Schwarz, which is comparable to the AIC (Field, 2013; Forster, 1998). However, it is slightly more conservative as it corrects more harshly for the number of parameters being estimated (Field, 2013).  It should be used when sample sizes are large, and the number of parameters is small (Field, 2013).

The AIC and BIC are the most commonly used measures for the fit of the model.  The values of these measures are all useful as a way of comparing models (Field, 2013).  The value of AIC, AICC, CAIC, and BIC can all be compared to their equivalent values in other models.  In all cases, smaller values mean better-fitting models (Field, 2013).

There is also Minimum Description Length (MDL) measure of Rissanen, which is based on the idea that statistical inference centers around capturing regularity in data; regularity, in turn, can be exploited to compress the data (Field, 2013; Vandekerckhove, Matzke, & Wagenmakers, 2015).  Thus, the goal is to find the model which compresses the data the most (Vandekerckhove et al., 2015).   There are three versions of MDL: crude two-part code, where the penalty for complex models is that they take many bits to describe, increasing the summed code length. In this version, it can be difficult to define the number of bits required to describe the model.  The second version of MDL is the Fisher Information approximation (FIA), which is similar to AIC and BIC in that it includes a first term that represents goodness-fo-fit, and additional terms that represent a penalty for complexity (Vandekerckhove et al., 2015).  The second term resembles that of BIC, and the third term reflects a more sophisticated penalty which represents the number of distinguishable probability distribution that a model can generate (Vandekerckhove et al., 2015).  The FIA differs from AIC and BIC in that it also accounts for functional form complexity, not just complexity due to the number of free parameters (Vandekerckhove et al., 2015).  The third version of MDL is normalized maximum likelihood (NML) which is simple to state but can be difficult to compute, for instance, the denominator may be infinite, and this requires further measures to be taken (Vandekerckhove et al., 2015). Moreover, NML requires integration over the entire set of possible datasets, which may be difficult to define as it depends on unknown decision process in the researchers (Vandekerckhove et al., 2015).

AIC and BIC in R: If there are (p) potential predictors, then there are 2p possible models (r-project.org, 2002).  AIC and BIC can be used in R as selection criteria for linear regression models as well as for other types of models.  As indicated in (r-project.org, 2002): the equations for AIC and BIC are as follows.

For the linear regression models, the -2log-likelihood (known as the deviance is nlog(RSS/n)) (r-project.org, 2002).  AIC and BIC need to get minimized (r-project.org, 2002).  The Larger models will fit better and so have smaller RSS but use more parameters (r-project.org, 2002).  Thus, the best choice of model will balance fit with model size (r-project.org, 2002).  The BIC penalizes larger models more heavily and so will tend to prefer smaller models in comparison to AIC (r-project.org, 2002). 

Example of the code in R using the state.x77 dataset is below. The function does not evaluate the AIC for all possible models but uses a search method that compares models sequentially as shown in the result of the R commands.

  • g <- lm(Life.Exp ~ ., data=state.x77.df)
  • step(g)

References

Bordens, K. S., & Abbott, B. B. (2008). Research Design and Methods: A Process Approach: McGraw-Hill.

Epstein, R. (1984). The principle of parsimony and some applications in psychology. The Journal of Mind and Behavior, 119-130.

Field, A. (2013). Discovering Statistics using IBM SPSS Statistics: Sage publications.

Forster, M. R. (1998). Parsimony and Simplicity. Retrieved from http://philosophy.wisc.edu/forster/220/simplicity.html, University of Wisconsin-Madison.

Hawkins, D. M. (2004). The problem of overfitting. Journal of chemical information and computer sciences, 44(1), 1-12.

Ledolter, J. (2013). Data mining and business analytics with R: John Wiley & Sons.

minitab.com. (2015). The Danger of Overfitting Regression Models. Retrieved from http://blog.minitab.com/blog/adventures-in-statistics-2/the-danger-of-overfitting-regression-models.

r-project.org. (2002). Practical Regression and ANOVA Using R Retrieved from https://cran.r-project.org/doc/contrib/Faraway-PRA.pdf.

Vandekerckhove, J., Matzke, D., & Wagenmakers, E.-J. (2015). Model Comparison and the Principle The Oxford handbook of computational and mathematical psychology (Vol. 300): Oxford Library of Psychology.

Quantitative Analysis of the “Faithful” Dataset Using R-Programming

Dr. O. Aly
Computer Science

Abstract

The purpose of this project is to analyze the faithful dataset. The project is divided into two main Parts.  Part-I evaluates and examines the DataSet for understanding the DataSet using the RStudio.  Part-I involves five significant tasks.  Part-II discusses the Pre-Data Analysis, by converting the Dataset to Data Frame, involving nine significant tasks to analyze the Data Frames.   The result shows that there is a relationship between Waiting Time until Next Eruption and the Eruption Time.   The probability value (p-value), known as the value of significance, should be very small like 0.001, 0.005, 0.01, or 0.05 for the relationship between the response variable and the independent variable to be significant. As the result shows, the probability of the error of the coefficient of eruptions is minimal almost near 0, i.e., <2e-16. Thus, we reject the null hypotheses that there is no significance of the parameter to the model and accept the alternative hypotheses that the parameter is significant to the model.  We conclude that there is a significant relationship between the response variable Waiting Time and the independent variable of Eruptions. The project also analyzed the comparison among three regressions: standard regression, polynomial regression, and lowess regression.  The result shows a similar relationship and lines between the three models.

Keywords: R-Dataset; Faithful Dataset; Regression Analysis Using R.

Introduction

This project examines and analyzes the dataset of faithful.csv (oldfaithful.csv).  The dataset is downloaded from http://vincentarelbundock.github.io/Rdatasets/.  The dataset has 272 observations on two variables; eruptions and waiting. The dataset is to describe the waiting time between eruptions and the duration of the eruption for the Old Faithful geyser in Yellowstone National Park, Wyoming, USA.  A closer look at the failthful$eruptions reveals that these are heavily rounded times originally in seconds, where multiples of 5 are more frequency than expected under non-human measurement.  The eruption variable is numeric for the eruption time in minutes.  The waiting variable is numeric for the waiting time to next eruption in minutes. The geyser is in package MASS.  There are two Parts.  Part-I addresses five tasks to examine and understand the dataset using R before the analysis as follows:

Part-II address the analysis using R. Part-II includes seven tasks include the following. These seven tasks are followed by the discussion and analysis of the results. 

  • Task-1: The first five records of the dataset.
  • Task-2: Density Histograms and Smoothed Density Histograms.
  • Task-3: Standard Linear Regression
  • Task-4: Polynomial Regression.
  • Task-5: Lowess Regression.
  • Task-6: The Summary of the Model.
  • Task-7: Comparison of Linear Regressions, Polynomial Regression, and Lowess Regression.
  • Task-8: The Summary of all Models.
  • Task-9:  Discussion and Analysis.

Various resources were utilized to develop the required code using R. These resources include (Ahlemeyer-Stubbe & Coleman, 2014; Fischetti, Mayor, & Forte, 2017; Ledolter, 2013; r-project.org, 2018).

Part-I:  Understand and Examine the Dataset “faithful.”

Task-1:  Install MASS Package

The purpose of this task is to install the MASS package which is required for this project. The faithful.cxv requires this package.

  • Command: >install.packages(“MASS”)

Task-2:  Understand the Variables of the Data Sets

The purpose of this task is to understand the variables of the dataset.  The dataset is a “faithful” dataset. It describes the Waiting Time between Eruptions and the duration of the Eruption for the Old Faithful geyser in Yellowstone National Park, Wyoming, USA.  The dataset has 272 observations on two main variables:

  • Eruptions: numeric Eruption time in minutes.
  • Waiting: numeric Waiting time to next eruption in minutes.

Task-3:  Examine the Variables of the Data Sets

The main dataset is called “faithful.csv” dataset, which includes two main variables eruptions and waiting.

  • ##Examine the dataset
  • data()
  • ?faithful
  • install.packages(“MASS”)
  • install.packages(“lattice”)
  • library(lattice)
  • faithful <- read.csv(“C:/CS871/Data/faithful.csv”)
  • data(faithful)
  • summary(faithful)

Figure 1.  Eruptions and Waiting for Eruption Plots for Faithful dataset.

Task-4: Create a Data Frame to repreent the dataset of faithful.

  • ##Create DataFrame
  • faithful.df <- data.frame(faithful)
  • faithful.df
  • summary(faithful.df)

Task-5: Examine the Content of the Data Frame using head(), names(), colnames(), and dim() functions.

  • names(faithful.df)
  • head(faithful.df)
  • dim(faithful.df)

Part-II: Discussion and Analysis

Task-1:  The first Ten lines of Waiting and Eruptions.

  • ##The first ten lines of Waiting and Eruptions
  • faithful$waiting[1:10]
  • faithful$eruption[1:10]
  • ##The descriptive analysis of waiting and eruptions
  • summary(faithful$waiting)
  • summary(faithful$eruptions)

Task-2:  Density Histograms, and Smoothed Density Histograms.

  • ##Density histogram for Waiting Time
  • hist(faithful.df$waiting, col=”blue”, freq=FALSE, main=”Histogram of Waiting Time to Next Eruption”, xlab=”Waiting Time To Next Eruption In Minutes”)
  • ##smoothed density histogram for Waiting Time
  • smoothedDensity_waiting <- locfit(~lp(waiting), data=faithful.df)
  • plot(smoothedDensity_waiting, col=”blue”,  main=”Histogram of Waiting Time to Next Eruption”, xlab=”Waiting Time To Next Eruption In Minutes”)
  • ##Density histogram for Eruptions
  • hist(faithful.df$eruptions, col=”red”, freq=FALSE, main=”Histogram of Eruption Time”, xlab=”Eruption Time In Minutes”)
  • ##smoothed density histogram for Eruptions
  • smoothedDensity_eruptions <- locfit(~lp(waiting), data=faithful.df)
  • plot(smoothedDensity_eruptions, col=”red”,  main=”Histogram of Waiting Time to Next Eruption”, xlab=”Waiting Time To Next Eruption In Minutes”)

Figure 2.  Density Histogram and Smoothed Density Histogram of Waiting Time.

Figure 3.  Density Histogram and Smoothed Density Histogram of Eruption.

Task-3: Standard Linear Regression

            The purpose of this task is to examine the Standard Linear Regression for the two main factors of the faithful dataset Waiting Time until Next Eruption and Eruption Time.  This task also addresses the diagnostic plots of the standard linear regression such as residuals vs. fitted as examined below.  The R codes are as follows:

  • ##Standard Regression of waiting time on eruption time.
  • lin.reg.model=lm(waiting~eruptions, data=faithful.df)
  • plot(waiting~eruptions, data=faithful, col=”blue”, main=”Regression of Two Factors of Waiting and Eruption Time”)
  • abline(lin.reg.model, col=”red”)

Figure 4.  Regression of Two Factors of Waiting and Eruption Time.

            The following graphs represent the diagnostic plots for the standard linear regressions.  The first plot represents the residual vs. fitted. The second plot represents the Normal Q-Q. The third plot represents Scale-Location. The fourth plot represents Residuals vs. Leverage.  The discussion and analysis of these graphs under the discussion analysis section of this project.

Figure 5.  Diagnostic Plots for Standard Linear Regression.

Task-4: Polynomial Regression

            The purpose of this task is to examine the polynomial regression for the Waiting Time Until Next Eruption and the Eruption Time variables. The R codes are as follows:

Figure 6.  Polynomial Regreession.

Task-5: Lowess Regression

            The purpose of this task is to examine the Lowess Regression.  The R codes are as follows:

Figure 7.  Lowess Regression.

Task-6: Summary of the Model.

            The purpose of this task is to examine the descriptive analysis summary such as residuals, intercept, R-squared.  The R code is as follows:

  • summary(model1)

Task-7:  Comparison of Linear Regression, Polynomial Regression and Lowess Regression.

  • ##Comparing local polynomial regression to the standard regression.
  • lowessReg=lowess(faithful$waiting~faithful$eruptions, f=2/3)
  • local.poly.reg <-locfit(waiting~lp(eruptions, nn=0.5), data=faithful)
  • standard.reg=lm(waiting~eruptions, data=faithful)
  • plot(faithful$waiting~faithful$eruptions, main=”Eruptions Time”, xlab=”Eruption Time in Minutes”, ylab=”Waiting Time to Next Eruption Time”, col=”blue”)
  • lines(lowessReg, col=”red”)
  • abline(standard.reg, col=”green”)
  • lines(local.poly.reg, col=”yellow”)

Figure 8.  Regression Comparison for the Eruptions and Waiting Time Variables.

Task-8:  Summary of these Models

            The purpose of this task is to examine the summary of each mode. The R codes are as follows:

  • ##Summary of the regressions
  • summary(lowessReg)
  • summary(local.poly.reg)
  • summary(standard.reg)
  • cor(faithful.df$eruptions, faithful.df$waiting)

Task-9: Discussion and Analysis

            The result shows that the descriptive analysis of the average for the eruptions is 3.49, which is lower than the median value of 4.0 minutes, indicating a negatively skewed distribution.  The average for the waiting time until the next eruptions is 70.9 which is less than the median of 76.0 indicating a negatively skewed distribution.  Figure 2 illustrated the density histogram and smoothed density histogram of the waiting time. The result shows that the peak waiting time is ~80 minutes with the highest density point of 0.04.   Figure 3 illustrated the density histogram and smoothed density histogram of the eruption time in minutes.  The result shows that the peak eruption time in minutes is ~4.4 with the highest frequency density point of 0.6.  Figure 4 illustrates the linear regression of the two factors of waiting until next eruption and the eruption time in minutes.  The result shows that when the waiting time increases, the eruption time in minutes increases.  The residuals depict the difference between the actual value of the response variable and the value of the response variable predicted using the regression.  The maximum residual is shown as 15.97.  The spread of residuals is provided by specifying the values of min, max, median, Q1, and Q3 of the residuals. In this case, the spread is from -12.08 to 15.97.  Since the principle behind the regression line and the regression equation is to reduce the error or this difference, the expectation is that the median value should be very near to 0.  However, the median shows .21 which is higher than 0.  The prediction error can go up to the maximum value of the residual.  As this value is 15.97 which is not small, this residual cannot be accepted.   The result also shows that the value next to the coefficient estimate is the standard error of the estimate. Ths specifies the uncertainty of the estimate, then comes the “t” value of the standard error.  This value specifies as to how large the coefficient estimate is concerning the uncertainty.  The next value is the probability that the absolute(t) value is greater than the one specified which is due to a chance error.  The probability value (p-value), known as the value of significance, should be very small like 0.001, 0.005, 0.01, or 0.05 for the relationship between the response variable and the independent variable to be significant. As the result shows, the probability of the error of the coefficient of eruptions is very small almost near 0, i.e., <2e-16. Thus, we reject the null hypotheses that there is no significance of the parameter to the model and accept the alternate hypothesis that the parameter is significant to the model.  We conclude that there is a significant relationship between the response variable waiting time and the independent variable of eruptions.

The diagnostic plots of the standard regression are also discussed in this project. Figure 5 illustrates four different diagnostic plots of the standard regression.  This analysis also covers the residuals and fitted lines.  Figure 5 illustrated the Residuals vs. Fitted in Linear Regression Model for Waiting Time until Next Eruption as a function of the Eruptions Time in minutes.  The residuals depict the difference between the actual value of the response variable and the response variable predicted using the regression equation (Hodeghatta & Nayak, 2016).  The principle behind the regression line and the regression equation is to reduce the error or this difference (Hodeghatta & Nayak, 2016).  The expectation is that the median value should be very near to zero (Hodeghatta & Nayak, 2016).  For the model to pass the test of linearity, no pattern in the distribution of the residuals should exist (Hodeghatta & Nayak, 2016).  When there is no pattern in the distribution of the residuals, it passes the condition of linearity (Hodeghatta & Nayak, 2016).  The plot of the fitted values against the residuals with a line shows the relationship between the two. The horizontal and straight line indicates that the “average residual” for all “fitted values” it is more or less the same (Navarro, 2015).  The result of the Linear Regression for the identified variables of Eruptions and Waiting Time shows that the residual has a curved pattern, indicating that a better model can be obtained using the quadratic term because ideally, this line should be a straight horizontal line.  Figure 5 also illustrates the Normal Q-Q Plot, which is used to test the normality of the distribution (Hodeghatta & Nayak, 2016). The residuals are almost on the straight line, indicating that the residuals are normally distributed. Hence, the normality test of the residuals is passed.  Figure 5 also illustrates the Scale-Location graph, which is one of the graphs generated as part of the plot command above. The points are spread in a random fashion around the horizontal line but not equally the line. If the horizontal line with equally randomly spread points, the result could indicate that the assumption of constant variance of the errors or homoscedasticity is fulfilled (Hodeghatta & Nayak, 2016).  Thus, it is not fulfilled in this case.  Figure 5 also illustrates the Residuals vs. Leverage Plot generated for the Linear Regression Model. In this plot of Residuals vs. Leverage, the patterns are not as relevant as the case with the diagnostics plot of the linear regression.  In this plot, the outlying values at the upper right corner or the lower right corner are watched (Bommae, 2015).  Those spots are the places where a case can be influential against a regression line (Bommae, 2015).  When cases are outside of the Cook’s distance, meaning they have high Cook’s distance scores, the cases are influential to the regression results (Bommae, 2015).  The Cook’s distance lines are (red dashed line) are far indicating there is no influential case.

Regression assumes that the relationship between predictors and outcomes is linear.  However, non-linear relationships between variables can exist in some cases (Navarro, 2015).   There are some tools in statistics which can be employed to do non-linear regression.  The non-linear regression models assume that the relationship between predictors and outcomes is monotonic such as Isotonic Regression, while others assume that it is smooth but not necessarily monotonic such as Lowess Regression, while others assume that the relationship is of a known form which occurs to be non-linear such as Polynomial Regression (Navarro, 2015).  As indicated in (Dias, n.d.), Cleveland (1979) proposed the algorithm Lowess, as an outlier-resistant method based on local polynomial fits. The underlying concept is to start with a local polynomial (a k-NN type fitting) least square fit and then to use robust methods to obtain the final fit (Dias, n.d.).   The result of the Polynomial regression is also addressed in this project.  The polynomial regression shows a relationship between Waiting Time until Next Eruptions and the Eruption Time.  The line in Figure 6 is similar to the Standard Linear Regression.  Lowess Regression shows the same pattern on the relationship between Waiting Time until Next Eruptions and the Eruption Time.  The line in Figure 7 is similar to the Standards Linear Regression.  These three lines of the Standard Linear Regression, Polynomial Regression and Lowess Regression are illustrated together in a comparison fashion in Figure 8.   The coefficient correlation result shows that there is a positive correlation indicating the positive effect of the Eruptions Time on the Waiting Time until Next Eruption.

References

Ahlemeyer-Stubbe, A., & Coleman, S. (2014). A practical guide to data mining for business and industry: John Wiley & Sons.

Bommae, K. (2015). Understanding Diagnostic Plots of Linear Regression Analysis. Retrieved from https://data.library.virginia.edu/diagnostic-plots/.

Dias, R. (n.d.). Nonparametric Regression: Lowess/Loess. Retrieved from https://www.ime.unicamp.br/~dias/loess.pdf.

Fischetti, T., Mayor, E., & Forte, R. M. (2017). R: Predictive Analysis: Packt Publishing.

Hodeghatta, U. R., & Nayak, U. (2016). Business Analytics Using R-A Practical Approach: Springer.

Ledolter, J. (2013). Data mining and business analytics with R: John Wiley & Sons.

Navarro, D. J. (2015). Learning statistics with R: A tutorial for psychology students and other beginners. R package version 0.5.

r-project.org. (2018). R: A Language and Environment for Statistical Computing. Retrieved from https://cran.r-project.org/doc/manuals/r-release/fullrefman.pdf.


Quantitative Analysis of “Ethanol” Dataset Using R-Programming

Dr. Aly, O.
Computer Science

Introduction

The purpose of this discussion is to discuss locally weighted scatterplot smoothing known as LOWESS method for multiple regression models in a k-nearest-neighbor-based model.  The discussion also addresses whether the LOWESS is a parametric or non-parametric method.  The advantages and disadvantages of LOWESS from the computational standpoint are also addressed in this discussion.  Moreover, another purpose of this discussion is to select a dataset from http://vincentarelbundock.github.io/Rdatasets/ and perform a multiple regression analysis using R programming.  The dataset selected for this discussion is “ethanol” dataset.  The discussion begins with Multiple Regression, Lowess method, Lowess/Loess in R, and K-Nearest-Neighbor (k-NN), followed by the analysis of the “ethanol” dataset.

Multiple Regression

When there is more than one predictor variable, simple Linear Regression becomes Multiple Linear Regression, and the analysis becomes more involved (Kabacoff, 2011).  The Polynomial Regression typically is a particular case of the Multiple Regression (Kabacoff, 2011).  The Quadratic Regression has two predictors (X and X2), and Cubic Regression has three predictors (X, X2, and X3) (Kabacoff, 2011).  Where there is more than one predictor variable, the regression coefficients indicate the increase in the dependent variable for a unit change in a predictor variable, holding all other predictor variables constant (Kabacoff, 2011).   

Locally Weighted Scatterplot Smoothing (Lowess) Method

Regression assumes that the relationship between predictors and outcomes is linear.  However, non-linear relationships between variables can exist in some cases (Navarro, 2015).   There are some tools in statistics which can be employed to do non-linear regression.  The non-linear regression models assume that the relationship between predictors and outcomes is monotonic such as Isotonic Regression, while others assume that it is smooth but not necessarily monotonic such as Lowess Regression, while others assume that the relationship is of a known form which occurs to be non-linear such as Polynomial Regression (Navarro, 2015).  As indicated in (Dias, n.d.), Cleveland (1979) proposed the algorithm Lowess, as an outlier-resistant method based on local polynomial fits. The underlying concept is to start with a local polynomial (a k-NN type fitting) least square fit and then to use robust methods to obtain the final fit (Dias, n.d.).

Moreover, the Lowess and least square are non-parametric strategies for fitting a smooth curve to data points (statisticshowto.com, 2013).  The “parametric” indicates there is an assumption in advance that the data fits some distribution, i.e., normal distribution (statisticshowto.com, 2013). Parametric fitting can lead to fitting a smooth curve which misrepresents the data because some distribution is assumed in advance (statisticshowto.com, 2013).  Thus, in those cases, non-parametric smoothers may be a better choice (statisticshowto.com, 2013).  The non-parametric smoothers like Loess try to find a curve of best fit without assuming the data must fit some distribution shape (statisticshowto.com, 2013).  In general, both types of smoothers are used for the same set of data to offset the advantages and disadvantages of each type of smoother (statisticshowto.com, 2013). The benefits of non-parametric smoothing include providing a flexible approach to representing data, ease of use, easy computations (statisticshowto.com, 2013).  The disadvantages of the non-parametric smoothing include the following: (1) it cannot be used to obtain a simple equation for a set of data, (2) less well understood than parametric smoothers, and (3) it requires a little guesswork to obtain a result (statisticshowto.com, 2013). 

Lowess/Loess in R

Rhere are two versions of the lowess or loess scatter-diagram smoothing approach implemented in R (Dias, n.d.).  The former (lowess) was implemented first, while loess is more flexible and powerful (Dias, n.d.).  Example of lowess:

  • lowess(x,y f=2/3, iter=3, delta=.01*diff(range(x)))

where the following model is assumed: y = b(x)+e. 

  • The “f” is the smoother span which gives the proportion of points in the plot which influence the smooth at each value.  The larger values give more smoothness. 
    • The “iter” is the number of “robustifying” iterations which should be performed; using smaller values of “iter” will make “lowess” run faster. 
    • The “delta” represents the value of “x” which lies within “delta” of each other replace by a single value in the output from “lowess” (Dias, n.d.).

The loess() function uses a formula to specify the response (and in its application as a scatter-diagram smoother) a single predictor variable (Dias, n.d.).  The loess() function creates an object which contains the results, and the predict() function retrieves the fitted values.  These can be plotted along with the response variable (Dias, n.d.).  However, the points must be plotted in increasing order of the predictor variable in order for the lines() function to draw the line in an appropriate fashion, which is done using order() function applied to the predictor variable values and the explicit sub-scripting (in square brackets[]) to arrange the observations in ascending order (Dias, n.d.).

K-Nearest-Neighbor (K-NN)

The K-NN classifier is based on learning numeric attributes in an n-dimensional space. All of the training samples are stored in n-dimensional space with a unique pattern (Hodeghatta & Nayak, 2016).  When a new sample is given, the K-NN classifier searches for the pattern spaces which are closest to the sample and accordingly labels the class in the k-pattern space (called k-nearest-neighbor) (Hodeghatta & Nayak, 2016).  The “closeness” is defined regarding Euclidean distance, where the Euclidean distance between two points, X = (x1, x2, x3,.., xn)  and Y = (y1, y2, y3,.., yn) is defined as follows:

The unknown sample is assigned the nearest class among the K-NN pattern.  The aim is to look for the records which are similar to, or “near” the record to be classified in the training records which have values close to X = (x1, x2, x3,.., xn) (Hodeghatta & Nayak, 2016).  These records are grouped into classes based on the “closeness,” and the unknown sample will look for the class (defined by k) and identifies itself to that class which is nearest in the k-space (Hodeghatta & Nayak, 2016).   If a new record has to be classified, it finds the nearest match to the record and tags to that class (Hodeghatta & Nayak, 2016).  

The K-NN does not assume any relationship among the predictors(X) and class (Y) (Hodeghatta & Nayak, 2016).  However, it draws the conclusion of the class based on the similarity measures between predictors and records in the dataset (Hodeghatta & Nayak, 2016).  There are many potential measures, K-NN uses the Euclidean distance between the records to find the similarities to label the class (Hodeghatta & Nayak, 2016).  The predictor variable should be standardized to a common scale before computing the Euclidean distances and classifying (Hodeghatta & Nayak, 2016).  After computing the distances between records, a rule to put these records into different classes(k) is required (Hodeghatta & Nayak, 2016).  A higher value of (k) reduces the risk of overfitting due to noise in the training set (Hodeghatta & Nayak, 2016).  The value of (k) ideally can be between 2 and 10, for each time, to find the misclassification error and find the value of (k) which gives the minimum error (Hodeghatta & Nayak, 2016).

The advantages of the K-NN as a classification method include its simplicity and lack of parametric assumptions (Hodeghatta & Nayak, 2016).  It performs well for large training datasets (Hodeghatta & Nayak, 2016).  However, the disadvantages of the K-NN as a classification method include the time to find the nearest neighbors, reduced performance for a large number of predictors (Hodeghatta & Nayak, 2016). 

Multiple Regression Analysis for “ethanol” dataset Using R

This section is divided into five major Tasks.  The first task is to understand and examine the dataset.  Task-2, Task-3, and Task-4 are to understand density histogram, linear regression, and multiple linear regression.  Task-5 covers the discussion and analysis of the results.

Task-1:  Understand and Examine the Dataset.

The purpose of this task is to understand and examine the dataset. The description of the dataset is found in (r-project.org, 2018).  A data frame with 88 observations on the following three variables.

  • NOx Concentration of nitrogen oxides (NO and NO2) in micrograms/J.
  • C Compression ratio of the engine.
  • E Equivalence ratio–a measure of the richness of the air and ethanol fuel mixture.

#R-Commands and Results using summary(), names(), head(), dim(), and plot() functions.

  • ethanol <- read.csv(“C:/CS871/Data/ethanol.csv”)
  • data(ethanol)
  • summary(ethanol)
  • names(ethanol)
  • head(ethanol)
  • dim(ethanol)
  • plot(ethanol, col=”red”)

Figure 1.  Plot Summary of NOx, C, and E in Ethanol Dataset.

  • ethanol[1:3,]   ##First three lines
  • ethanol$NOx[1:10]  ##First 10 lines for concentration of nitrogen oxides (NOx)
  • ethanol$C[1:10]   ##First 10 lines for Compression Ratio of the Engine ( C )
  • ethanol$E[1:10]  ##First 10 lines for Equivalence Ratio ( E )
  • ##Descriptive Analysis using summary() function to analyze the central tendency.
  • summary(ethanol$NOx)
  • summary(ethanol$C)
  • summary(ethanol$E)

Task-2:  Density Histogram and Smoothed Density Histogram

  • ##Density histogram for NOx
  • hist(ethanol$NOx, freq=FALSE, col=”orange”)
  • install.packages(“locfit”)  ##locfit library is required for smoothed histogram
  • library(locfit)
  • smoothedDensity_NOx <- locfit(~lp(NOx), data=ethanol)
  • plot(smoothedDensity_NOx, col=”orange”, main=”Smoothed Density Histogram for NOx”)

Figure 2.  Density Histogram and Smoothed Density Histogram of NOx of Ethanol.

  • ##Density histogram for Equivalence Ration ( E )
  • hist(ethanol$E, freq=FALSE, col=”blue”)
  • smoothedDensity_E <- locfit(~lp(E), data=ethanol)
  • plot(smoothedDensity_E, col=”blue”, main=”Smoothed Density Histogram for Equivalence Ratio”)

Figure 3.  Density Histogram and Smoothed Density Histogram of E of Ethanol.

  • ##Density histogram for Compression Ratio ( C )
  • hist(ethanol$C, freq=FALSE, col=”blue”)
  • smoothedDensity_C <- locfit(~lp(C), data=ethanol)
  • plot(smoothedDensity_C, col=”blue”, main=”Smoothed Density Histogram for Compression Ratio”)

Figure 4.  Density Histogram and Smoothed Density Histogram of C of Ethanol.

Task-3:  Linear Regression Model

  • ## Linear Regression
  • lin.reg.model1=lm(NOx~E, data=ethanol)
  • lin.reg.model1
  • plot(NOx~E, data=ethanol, col=”blue”, main=”Linear Regression of NOx and Equivalence Ratio in Ethanol”)
  • abline(lin.reg.model1, col=”red”)
  • mean.NOx=mean(ethanol$NOx, na.rm=T)
  • abline(h=mean.NOx, col=”green”)

Figure 5:  Linear Regression of the NOx and E in Ethanol.

  • ##local polynomial regression of NOx on the equivalent ratio
  • ##fit with a 50% nearest neighbor bandwidth.
  • local.poly.reg <-locfit(NOx~lp(E, nn=0.5), data=ethanol)
  • plot(local.poly.reg, col=”blue”)

Figure 6:  Smoothed Polynomial Regression of the NOx and E in Ethanol.

Figure 7.  Residuals vs. Fitted Plots.

Figure 8.  Normal Q-Q Plot.

Figure 9. Scale-Location Plot.

Figure 10.  Residuals vs. Leverage.

  • ##To better understand the linearity of the relationship represented by the model.
  • summary(lin.reg.model1)
  • plot(lin.reg.model1)
  • crPlots(lin.reg.model1)
  • termplot(lin.reg.model1)

Figure 11.  crPlots() Plots for the Linearity of the Relationship between NOx and Equivalence Ratio of the Model.

##Examine the Correlation between NOx and E.

Task-4: Multiple Regressions

  • ##Produce Plots of some explanatory variables.
  • plot(NOx~E, ethanol, col=”blue”)
  • plot(NOx~C, ethanol, col=”red”)
  • ##Use vertical bar to find the relationship of E on NOx conditioned with C
  • coplot(NOx~E|C, panel=panel.smooth,ethanol, col=”blue”)
  • model2=lm(NOx~E*C, ethanol)
  • plot(model2, col=”blue”)

Figure 12. Multiple Regression – Relationship of E on NOx conditioned with C.

Figure 13. Multiple Regression Diagnostic Plot: Residual vs. Fitted.

Figure 14. Multiple Regression Diagnostic Plot: Normal Q-Q.

Figure 15. Multiple Regression Diagnostic Plot: Scale-Location.

Figure 16. Multiple Regression Diagnostic Plot: Residual vs. Leverage.

  • summary(model2)

Task-5:  Discussion and Analysis:  The result shows the average of NOx is 1.96, which is higher than the median of 1.75 indicating positive skewed distribution.  The average of the compression ratio of the engine ( C ) is 12.034 which is a little higher than the median of 12.00 indicating almost normal distribution.  The average ethanol equivalence ratio of measure ( E ) is 0.926, which is a little lower than the median of 0.932 indicating a little negative skewed distribution but close to normal distribution.  In summary, the average for NOx is 1.96, for C is 12.034 and for E is 0.926. 

The NOx exhaust emissions depend on two predictor variables: the fuel-air equivalence ratio ( E ), and the compression ratio ( C ) of the engine. The density of the NOx emissions and its smoothed version using the local polynomial regression are illustrated in Figure 2.  The result shows that the NOx starts to increase when the density starts at 0.15 and continues to increase.  However, after the density reaches 0.35, the NOx continues to increase while the density starts to drop.  Thus, there seems to be a positive relationship between NOx and density between 0.15 and .35 density, after which the relationship seems to go into the reverse and negative direction. 

The density of the Equivalence Ratio measure of the richness of air and ethanol fuel mixture and its smoothed version using the local polynomial regression are illustrated in Figure 3.  The result shows that the E varies with the density.  For instance, the density gets increased with the increased value of E until the density reaches ~1.5, and then it drops while the E continues to increase.  However, the density continues to drop until it reaches ~1.2, while the E continues to increase.   The density gets increased from ~1.2 until it reached ~1.6, and the E continues to increase. After density of ~1.6, the density gets dropped again while the E value continues to increase.  Thus, in summary, the density varies while the E value keeps increasing.

The density of the Compression Ratio of the Engine and its smoothed version using the local polynomial regression are illustrated in Figure 4.  The result shows that the C starts to increase when the density starts with ~0.09 and continues to increase.  However, after the density reaches ~0.11, the C continues to increase while the density starts to drop.  Thus, there seems to be a positive relationship between C and density between ~0.09 and ~.11 density, after which the relationship seems to go into the reverse and negative direction. 

Figure 5 illustrates the Linear Regression between the NOx and Equivalence Ratio in Ethanol. Figure 6 illustrates the Smoothed Polynomial Regression of the NOx and E in Ethanol. The result of the Linear Regression of the Equivalence Ratio ( E ) as a function of the NOx shows that while the E value increases, the NOx varies indicating an increase and then decrease.  Figure 6 shows the smoothed a polynomial regression of the NOx and E in ethanol, indicating the same result that there a positive association between E and NOx, meaning when E increases until it reaches ~0.9, NOx also increases until it reaches ~3.5. After that point, the relationship shows negative, meaning that the NOx gets increased with the increase of E. 

This analysis also covers the residuals and fitted lines.  Figure 7 illustrated the Residuals vs. Fitted in Linear Regression Model for NOx as a function of the E.  The residuals depicts the difference between the actual value of the response variable and the response variable predicted using the regression equation (Hodeghatta & Nayak, 2016).  The principle behind the regression line and the regression equation is to reduce the error or this difference (Hodeghatta & Nayak, 2016).  The expectation is that the median value should be very near to zero (Hodeghatta & Nayak, 2016).  For the model to pass the test of linearity, no pattern in the distribution of the residuals should exist (Hodeghatta & Nayak, 2016).  When there is no pattern in the distribution of the residuals, it passes the condition of linearity (Hodeghatta & Nayak, 2016).  The plot of the fitted values against the residuals with a line shows the relationship between the two. The horizontal and straight line indicates that the “average residual” for all “fitted values” it is more or less the same (Navarro, 2015).

The result of the Linear Regression for the identified variables of E and NOx shows that the residual has a curved pattern, indicating that a better model can be obtained using the quadratic term because ideally, this line should be a straight horizontal line.  Figure 8 illustrates the Normal Q-Q Plot, which is used to test the normality of the distribution (Hodeghatta & Nayak, 2016).  Figure 8 shows that the residuals are almost on the straight line, indicating that the residuals are normally distributed. Hence, the normality test of the residuals is passed.  Figure 9 illustrates the Scale-Location graph, which is one of the graphs generated as part of the plot command above. The points are spread in a random fashion around the horizontal line but not equally the line. If the horizontal line with equally randomly spread points, the result could indicate that the assumption of constant variance of the errors or homoscedasticity is fulfilled (Hodeghatta & Nayak, 2016).  Thus, it is not fulfilled in this case.  Figure 10 illustrates the Residuals vs. Leverage Plot generated for the Linear Regression Model. In this plot of Residuals vs. Leverage, the patterns are not as relevant as the case with the diagnostics plot of the linear regression.  In this plot, the outlying values at the upper right corner or the lower right corner are watched (Bommae, 2015).  Those spots are the places where a case can be influential against a regression line (Bommae, 2015).  When cases are outside of the Cook’s distance, meaning they have high Cook’s distance scores, the cases are influential to the regression results (Bommae, 2015).  The Cook’s distance lines are (red dashed line) are far indicating there is no influential case.   Figure 11 illustrates the crPlots() function, which is used to understand better the linearity of the relationship represented by the model (Hodeghatta & Nayak, 2016).  The non-linearity requires to re-explore the model (Hodeghatta & Nayak, 2016).  The result of Figure 12 shows that the model created is not linear, which requires to re-explore the model. Moreover, the correlation between NOx and E result shows there is a negative correlation between NOx and E with a value of -0.11.   Figure 12 illustrates the Multiple Regression and the Relationship of Equivalence Ratio on NOx conditioned with Compression Ratio.  The Multiple Linear Regression is useful for modeling the relationship between a numeric outcome or dependent variable (Y), and multiple explanatory or independent variables (X).  The result shows that the interaction of C and E affects the NOx.  While the E and C increase, the NOx decreases.   Approximately 0.013 of variation in NOx can be explained by this model (E*C).   The interaction of E and C has a negative value of -0.063 on NOx. 

References

Bommae, K. (2015). Understanding Diagnostic Plots of Linear Regression Analysis. Retrieved from https://data.library.virginia.edu/diagnostic-plots/.

Dias, R. (n.d.). Nonparametric Regression: Lowess/Loess. Retrieved from https://www.ime.unicamp.br/~dias/loess.pdf.

Hodeghatta, U. R., & Nayak, U. (2016). Business Analytics Using R-A Practical Approach: Springer.

Kabacoff, R. I. (2011). IN ACTION.

Navarro, D. J. (2015). Learning statistics with R: A tutorial for psychology students and other beginners. R package version 0.5.

r-project.org. (2018). R: A Language and Environment for Statistical Computing. Retrieved from https://cran.r-project.org/doc/manuals/r-release/fullrefman.pdf.

statisticshowto.com. (2013). Lowess Smoothing: Overview. Retrieved from http://www.statisticshowto.com/lowess-smoothing/.

Quantitative Analysis of “State.x77” Dataset Using R-Programming

Dr. Aly, O.
Computer Science

Introduction

The purpose of this discussion is to continue working with R using state.x77 dataset for this assignment.  In this task, the dataset will get converted to a data frame.  Moreover, regression will be performed on the dataset.  The commands used in this discussion are derived from (r-project.org, 2018).  There are four major tasks.  The discussion begins with Task-1 to understand and examine the dataset.  Task-2 covers the data frame creation. Task-3 is to examine the data frame.  Task-4 investigates the data frame using the Linear Regression analysis.  Task-4 is comprehensive as it covers the R commands, the results of the commands and the analysis of the result. 

Task-1:  Understand and Examine the dataset:

The purpose of this task is to understand and examine the dataset.  The following is a summary of the variables from the information provided in the help site as a result of ?state.x77 command:

  • Command: > ?state.x77
  • Command: > summary(state.x77)
  • Command: >head(state.x77)
  • Command: >dim(state.x77)
  • Command:  >list(state.x77)

The dataset of state.x77has 50 rows and 8 columns giving the following statistics in the respective columns.

##The first 10 lines of Income, Illiteracy, and Murder.

  • state.x77.df$Income[1:10]
  • state.x77.df$Illiteracy[1:10]
  • state.x77.df$Murder[1:10]

The descriptive statistical analysis (Central Tendency) (mean, median, min, max, 3th quantile) of the Income, Illiteracy, and Population variables.

  • Command:>summary(state.x77.df$Income)
  • Command:>summary(state.x77.df$Illiteracy)
  • Command:>summary(state.x77.df$Population)

Task2:  Create a Data Frame

  • Command: >state.x77.df <- data.frame(state.x77)
  • Command:>state.selected.variables <- as.data.frame(state.x77[,c(“Murder”, “Population”, “Illiteracy”, “Income”, “Frost”)])

Task-3: Examine the Data Frame

  • Command: > list(state.x77.df)
  • Command: >names(state.x77.df)

Task-4: Linear Regression Model – Commands, Results and Analysis:

  • plot(Income~Illiteracy, data=state.x77.df)
  • mean.Income=mean(state.x77.df$Income, na.rm=T)
  • abline(h=mean.Income, col=”red”)
  • model1=lm(Income~Illiteracy, data=state.x77.df)
  • model1

Figure 1.  Linear Regression Model for Income and Illiteracy.

Analysis: Figure 1 illustrates the Linear Regression between Income and Illiteracy.  The result of the Linear Regression of the Income as a function of the Illiteracy shows that the income increases when the illiteracy percent decreases, and vice versa, indicating there is a reverse relationship between the illiteracy and income. More analysis on the residuals and the fitted lines are discussed below using plot() function in R. 

  • Command: > plot(model1)

Figure 2.  Residuals vs. Fitted in Linear Regression Model for Income and Illiteracy.

Analysis:  Figure 2 illustrated the Residuals vs. Fitted in the Linear Regression Model for Income as a function of the Illiteracy. The residuals depict the difference between the actual value of the response variable and the response variable predicted using the regression equation (Hodeghatta & Nayak, 2016).  The principle behind the regression line and the regression equation is to reduce the error or this difference (Hodeghatta & Nayak, 2016).  The expectation is that the median value should be very near to zero (Hodeghatta & Nayak, 2016). For the model to pass the test of linearity, no pattern in the distribution of the residuals should exist (Hodeghatta & Nayak, 2016).  When there is no pattern in the distribution of the residuals, it passes the condition of linearity (Hodeghatta & Nayak, 2016).  The Plot of the fitted values against the residuals with a line shows the relationship between the two.  The horizontal and straight line indicates that the “average residual” for all “fitted values” is more or less the same (Navarro, 2015).   The result of the Linear Regression for the identified variables of Illiteracy and Income (Figure 2) shows that the residual has a curved pattern, indicating that a better model can be obtained using the quadratic term because ideally, this line should be a straight horizontal line. 

Figure 3.  Normal Q-Q Plot of the Linear Regression Model for Illiteracy and Income.

Analysis: Figure 3 illustrates the Normal Q-Q plot, which is used to test the normality of the distribution (Hodeghatta & Nayak, 2016).  The result shows that the residuals are almost on the straight line in the preceding Normal Q-Q plot, indicating that the residuals are normally distributed.  Hence, the normality test of the residuals is passed.

Figure 4. Scale-Location Plot Generated in R to Validate Homoscedasticity for Illiteracy and Income.

Analysis: Figure 4 illustrates the Scale-Location graph, which is one of the graphs generated as part of the plot command above.  The points are spread in a random fashion around the near horizontal line, as such ensures that the assumption of constant variance of the errors (or homoscedasticity) is fulfilled (Hodeghatta & Nayak, 2016).

Figure 5. Residuals vs. Leverage Plot Generated in R for the LR Model.

Analysis: Figure 5 illustrates the Residuals vs. Leverage Plot generated for the LR Model.  In this plot of Residuals vs. Leverage, the patterns are not relevant as the case with the diagnostics plot of the linear regression.  In this plot, the outlying values at the upper right corner or the lower right corner are watched (Bommae, 2015).  Those spots are the places where a case can be influential against a regression line (Bommae, 2015).  When cases are outside of the Cook’s distance, meaning they have high Cook’s distance scores, the cases are influential to the regression results (Bommae, 2015). 

##Better understand the linearity of the relationship represented by the model.

  • Command: >crPlots(model1)

Figure 6.  crPlots() Plots for the Linearity of the Relationship between Income and Illiteracy of the Model.

Analysis:  Figure 6 illustrates the crPlots() function, which is used to understand better the linearity of the relationship represented by the model (Hodeghatta & Nayak, 2016).  The non-linearity requires to re-explore the model (Hodeghatta & Nayak, 2016).  The result of Figure 6 shows that the model created is linear and the reverse relationship between income and the illiteracy as analyzed above in Figure 1.

##Examine the Correlation between Income and Illiteracy.

Analysis: The correlation result shows a negative association between income and illiteracy as anticipated in the linear regression model.

References: 

Bommae, K. (2015). Understanding Diagnostic Plots of Linear Regression Analysis. Retrieved from https://data.library.virginia.edu/diagnostic-plots/.

Hodeghatta, U. R., & Nayak, U. (2016). Business Analytics Using R-A Practical Approach: Springer.

Navarro, D. J. (2015). Learning statistics with R: A tutorial for psychology students and other beginners. R package version 0.5.

r-project.org. (2018). R: A Language and Environment for Statistical Computing. Retrieved from https://cran.r-project.org/doc/manuals/r-release/fullrefman.pdf.

The Assumptions of General Least Square Modeling for Regression and Correlations

Dr. Aly, O.
Computer Science

Introduction

The purpose of this discussion is to compare the assumptions of General Least Square Model (GLM) modeling for regression and correlations.  This discussion also covers the issues with transforming variables to make them linear.  The procedure in R for linear regression is also addressed in this assignment.  The discussion begins with some basics such as measurement scale, correlation, and regression, followed by the main topics for this discussion.

Measurement Scale

There are three types of measurement scale.  There is nominal (categorical) such as race, color, job, sex or gender, job status and so forth (Kometa, 2016).  There is ordinal (categorical) such as the effect of a drug could be none, mild and severe, job importance (1-5, where 1 is not important and 5 very important and so forth) (Kometa, 2016).  There is the interval (continuous, covariates, scale metric) such as temperature (in Celsius), weight (in kg), heights (in inches or cm) and so forth (Kometa, 2016). The interval variables have all the properties of nominal and ordinal variables (Bernard, 2011).  They are an exhaustive and mutually exclusive list of attributes, and the attributes have a rank-order structure (Bernard, 2011).  They have one additional property which is related to the distance between attributes (Bernard, 2011). The distance between the attributes are meaningful (Bernard, 2011). Therefore, the interval variables involve true quantitative measurement (Bernard, 2011).

Correlations

Correlation analysis is used to measure the association between two variables.  A correlation coefficient ( r ) is a statistic used for measuring the strength of a supposed linear association between two variables (Kometa, 2016).  The correlation analysis can be conducted using interval data, ordinal data, or categorical data (crosstabs) (Kometa, 2016).  The fundamental concept of the correlation requires the analysis of two variables simultaneously to find whether there is a relationship between the two sets of scores, and how strong or weak that relationship is, presuming that a relationship does, in fact, exist (Huck, Cormier, & Bounds, 2012).  There are three possible scenarios within any bivariate data set.  The first scenario is referred to as high-high, low-low when the high and low score on the first variable tend to be paired with the high and low score of the second variable respectively.  The second scenario is referred to as high-low, low-high, when the relationship represents inverse, meaning when the high and low score of the first variable tend to be paired with a low and high score of the second variable.  The third scenario is referred to as “little systematic tendency,” when some of the high and low scores on the first variable are paired with high scores on the second variable, whereas other high and low scores on the first variable are paired with low scores of the second variable (Huck et al., 2012).

The correlation coefficient varies from -1 and +1 (Huck et al., 2012; Kometa, 2016).  Any ( r ) falls on the right side represents a positive correlation, indicating a direct relationship between the two measured variables, which can be categorized under the high-high, low-low scenario.  However, any ( r ) falls on the left side represents a negative correlation, indicating indirect, or inverse, relationship, which can be categorized under high-low, low-high scenario.   If ( r ) lands on either end of the correlation continuum, the term “perfect” may be used to describe the obtained correlation. The term high comes into play when ( r ) assumes a value close to either end, thus, implying a “strong relationship,” conversely, the term low is used when ( r ) lands close to the middle of the continuum, thus, implying a “weak relationship.”   Any ( r ) ends up in the middle area of the left, or right side of the correlation continuum is called “moderate” (Huck et al., 2012).  Figure 1 illustrates the correlation continuum of values -1 and +1.

Figure 1. Correlation Continuum (-1 and +1) (Huck et al., 2012).

The most common correlation coefficient is the Pearson correlation coefficient, used to measure the relationship between two interval variables (Huck et al., 2012; Kometa, 2016).  Pearson correlation is designed for situations where each of the two variables is quantitative, and each variable is measured to produce raw scores (Huck et al., 2012).  Spearman’s Rho is the second most popular bivariate correlational technique, where each of the two variables is measured to produce ranks with resulting correlation coefficient symbolized as rs or p (Huck et al., 2012).  Kendall’s Tau is similar to Spearman’s Rho (Huck et al., 2012). 

Regression

When dealing with correlation and association between statistical variables, the variables are treated in a symmetric way. However, when dealing with the variables in a non-symmetric way, a predictive model for one or more response variables can be derived from one or more of the others (Giudici, 2005).  Linear Regression is a predictive data mining method (Giudici, 2005; Perugachi-Diaz & Knapik, 2017).

Linear Regression is described to be the most important prediction method for continuous variables, while Logistic Regression is the main prediction method for qualitative variables (Giudici, 2005).  Cluster analysis is different from Logistic Regression and Tree Models, as in the cluster analysis the clustering is unsupervised in the cluster analysis and is measured with no reference variables, while in Logistic Regress and Tree Models, the clustering is supervised and is measured against a reference variables such as response whose levels are known (Giudici, 2005).

The Linear Regression is to examine and predict data by modeling the relationship between the dependent variable also called “response” variable, and the independent variable also known as “explanatory” variable.  The purpose of the Linear Regression is to find the best statistical relationship between these variables to predict the response variable or to examine the relationship between the variables (Perugachi-Diaz & Knapik, 2017). 

Bivariate Linear Regression can be used to evaluate whether one variable called dependent variable or the response can be caused, explained and therefore predicted as a function of another variable called independent, the explanatory variable, the covariate or the feature (Giudici, 2005).  The Y is used for the dependent or response variable, and X is used for the independent or explanatory variable (Giudici, 2005). Linear Regression is the simplest statistical model which can describe Y as a function of an X (Giudici, 2005).  The Linear Regression model specifies a “noisy” linear relationship between variables Y and X, and for each paired observation (xi, yi), the following Regression Function is used (Giudici, 2005; Schumacker, 2015).

Where: 

  • i = 1, 2, …n
  • a = The intercept of the regression function.
  • b = The slope coefficient of the regression function also called the regression coefficient.
  • ei = the random error of the regression function, relative to the ith observation.

The Regression Function has two main elements; the Regression Line and the Error Term.  The Regression Line can be developed empirically, starting from the matrix of available data. The Error Term describes how well the regression line approximates the observed response variable.  The determination of the Regression Line can be described as a problem of fitting a straight line to the observed dispersion diagram, where the Regression Line is the Linear Function using the following formula (Giudici, 2005).

Where: 

 = indicates the fitted ith value of the dependent variable, calculated on the basis of the ith value of the explanatory variable of xi.

The Regression Line simple formula, as indicated in (Bernard, 2011; Schumacker, 2015) is as follows:

Where: 

  • y = variable value of dependent variable.
  • a and b are some constants.
  • x = the variable value of the independent variable.

The Error Term of ei in the expression of the Regression Function represents, for each observation yi, the residual, namely the difference between the observed response values yi, and the corresponding values fitted with the Regression Line using the following formula (Giudici, 2005):

Each residual can be interpreted as the part of the corresponding value that is not explained by the linear relationship with the explanatory variable.  To obtain the analytic expression of the regression line, it is sufficient to calculate the parameters a and b on the basis of the available data. The method of least square is often used for this. It chooses the straight line which minimizes the sum of squares of the errors of the fit (SSE), defined by the following formula (Giudici, 2005). 

Figure 2 illustrates the representation of the regression line.

Figure 2.  Representation of the Regression Line (Giudici, 2005).

General Least Square Model (GLM) for Regression and Correlations

The Linear Regression is based on the Gauss-Markov theorem, which states that if the errors of prediction are independently distributed, sum to zero and have constant variance, then the least squares estimation of the regression weight is the best linear unbiased estimator of the population (Schumacker, 2015).   The Gauss-Markov theorem provides the rule that justifies the selection of a regression weight based on minimizing the error of prediction, which gives the best prediction of Y, which is referred to as the least squares criterion, that is, selecting regression weights based on minimizing the sum of squared errors of prediction (Schumacker, 2015). The least squares criterion is sometimes referred to as BLUE, or Best Linear Unbiased Estimator (Schumacker, 2015).

Several assumptions are made when using Linear Regression, among which is one crucial assumption known as “independence assumption,” which is satisfied when the observations are taken on subjects which are not related in any sense (Perugachi-Diaz & Knapik, 2017).  Using this assumption, the error of the data can be assumed to be independent (Perugachi-Diaz & Knapik, 2017).  If this assumption is violated, the errors exist to be dependent, and the quality of statistical inference may not follow from the classical theory (Perugachi-Diaz & Knapik, 2017). 

Regression works by trying to fit a straight line between these data points so that the overall distance between points and the line is minimized using the statistical method called least square.  Figure 3 illustrates an example of a Scatter Plot of two variables, e.g., English and Maths Scores (Muijs, 2010).  

Figure 3. Example of a Scatter Plot of two Variables, e.g. English and Maths Scores (Muijs, 2010).

In Pearson’s correlation, ( r ) measures how much changes in one variable correspond with equivalent changes in the other variables (Bernard, 2011). It can also be used as a measure of association between an interval and an ordinal variable or between an interval and a dummy variable which are nominal variable coded as 1 or 0, present or absent (Bernard, 2011).  The square of Pearson’s r or r-squared is a PRE (proportionate reduction of error) measure of association for linear relations between interval variables (Bernard, 2011).  It indicates how much better the scores of a dependent variable can be predicted if the scores of some independent variables are known (Bernard, 2011).  The dots illustrated in Figure 4 is physically distant from the dotted mean line by a certain amount. The sum of the squared distances to the mean is the smallest sum possible which is the smallest cumulative prediction error giving the mean of the dependent is only known (Bernard, 2011).  The distance from the dots above the line to the mean is positive; the distances from the dots below the line to the mean are negative (Bernard, 2011).  The sum of the actual distances is zero.  Squaring the distances gets rid of the negative numbers (Bernard, 2011).  The solid line that runs diagonally through the graph in Figure 4 minimizes the prediction error for these data.  This line is called the best fitting line, or the least square line, or the regression line (Bernard, 2011).   

Figure 4.  Example of a Plot of Data of TFR and “INFMORT” for Ten countries (Bernard, 2011).

Transformation of Variables for Linear Regression

The transformation of the data can involve the data transformation of the data matrix in univariate and multivariate frequency distributions (Giudici, 2005).  It can also involve a process to simplify the statistical analysis and the interpretation of the results (Giudici, 2005).  For instance, when the p variables of the data matrix are expressed in different measurement units, it is a good idea to put all the variables into the same measurement unit so that the different measurement scales do not affect the results (Giudici, 2005).  This transformation can be implemented using the linear transformation to standardize the variables, taking away the average of each one and dividing it by the square root of its variance (Giudici, 2005).  There is other data transformation such as the non-linear Box-Cox transformation (Giudici, 2005).

The transformation of the data is also a method of solving problems with data quality, perhaps because items are missing or because there are anomalous values, known as outliers (Giudici, 2005).  There are two primary approaches to deal with missing data; remove it, or substitute it using the remaining data (Giudici, 2005).  The identification of anomalous values requires a formal statistical analysis; an anomalous value can seldom be eliminated as its existence often provides valuable information about the descriptive or predictive model connected to the data under examination (Giudici, 2005). 

The underlying concept behind the transformation of the variables is to correct for distributional problems, outliers, lack of linearity or unequal variances (Field, 2013).  The transformation of the variables changes the form of the relationships between variables, but the relative differences between people for a given variable stay the same. Thus, those relationships can still be quantified (Field, 2013).  However, it does change the differences between different variables because it changes the units of measurement (Field, 2013).  Thus, in the case of a relationship between variables, e.g., regression, the transformation is implemented at the problematic variable. However, in case of differences between variables such as a change in a variable over time, then the transformation is implemented for all of those variables (Field, 2013). 

There are various transformation techniques to correct various problems.  Log Transformation (log(Xi)) method can be used to correct for positive skew, positive kurtosis, unequal variances, lack of linearity (Field, 2013).  Square root transformation (ÖXi ) can be used to correct for positive skew, positive kurtosis, unequal variances, and lack of linearity (Field, 2013).  Reciprocal Transformation (1/Xi) can be used to correct for positive skew, positive kurtosis, unequal variances (Field, 2013).  The Reverse Score Transformation can be used to correct for negative skew (Field, 2013).  Table 1 summarizes these types of transformation and their correction use.

Table 1.  Transformation of Data Methods and their Use. Adapted from (Field, 2013).

Procedures in R for Linear Regressions

In R, there is a package called “stats” package which contains two different functions which can be used to estimate the intercept and slope in the linear regression equation (Schumacker, 2015). These two functions in R are lm() and lsfit() (Schumacker, 2015).  The lm() function uses a data frame, while the lsfit() uses a matrix or data vector.  The lm() function outputs an intercept term, which has meaning when interpreting results in linear regression.   The lm() function can also specify an equation with no intercept of the form (Schumacker, 2015). 

Example of lm() function with intercept on y as dependent variable and x as independent variable: 

  • LReg = lm(y ~ x, data = dataframe).

Example of lm() function with no intercept on y as dependent variable and x as independent variable: 

  • LReg = lm(y ~ 0 + x, data=dataframe) or
  • LReg  = lm(y ~ x – 1, data = dataframe)

 The expectation when using the lm() function is that the response variable data is distributed normally (Hodeghatta & Nayak, 2016).  However, the independent variables are not required to be normally distributed (Hodeghatta & Nayak, 2016).  Predictors can be factors (Hodeghatta & Nayak, 2016).

#cor() function to find the correlation between variables

cor(x,y)

#To build linear regression model with R

model <-lm(y ~ x, data=dataset)

References

Bernard, H. R. (2011). Research methods in anthropology: Qualitative and quantitative approaches: Rowman Altamira.

Field, A. (2013). Discovering Statistics using IBM SPSS Statistics: Sage publications.

Giudici, P. (2005). Applied data mining: statistical methods for business and industry: John Wiley & Sons.

Hodeghatta, U. R., & Nayak, U. (2016). Business Analytics Using R-A Practical Approach: Springer.

Huck, S. W., Cormier, W. H., & Bounds, W. G. (2012). Reading statistics and research (6th ed.): Harper & Row New York.

Kometa, S. T. (2016). Getting Started With IBM SPSS Statistics for Windows: A Training Manual for Beginners (8th ed.): Pearson.

Muijs, D. (2010). Doing quantitative research in education with SPSS: Sage.

Perugachi-Diaz, Y., & Knapik, B. (2017). Correlation in Linear Regression.

Schumacker, R. E. (2015). Learning statistics using R: Sage Publications.

Quantitative Analysis of “Births2006.smpl” Dataset Using R-Programming

Dr. Aly, O.
Computer Science

Abstract

The purpose of this project is to analyze the selected dataset of the births2006.smpl.  The dataset is part of the R library “nutshell.” The project is divided into two main Parts.  Part-I evaluates and examines the dataset for understanding the Dataset using the R.  Part-I involves five significant tasks for the examination of the dataset. Part-II is about the Data Analysis of the dataset.  The Data Analysis involves nine significant tasks.  The first eight tasks involve the codes and the results with Plot Graphs, and Bar Charts for analysis.   Task-9 is the last task of Part-II for discussion and analysis. The most observed results include the higher number of the birth during the working days of Tuesday through Thursday than the weekend, and the domination of the vaginal method over the C-section.  The result also shows that the average birth weight gets increased among the male babies for quintuplet while the trend continues to decline among the female babies. The researcher recommends further statistical significance, and the effect size tests to verify these results and examine the interaction among specific variables such as birth weight and Apgar score.

Keywords: Births2006.smpl; Box Plot and Graphs Analysis Using R.

Introduction

This project examines and analyzes the dataset of births2006.smpl which is part of the Nutshell package of RStudio.  This dataset contains information on babies born in the United in the year 2006.  The source of this dataset is (https://www.cdc.gov/NCHS/data_access/VitalStatsOnline.htm).  There is only one record per birth.  The dataset is a random ten percent sample of the original data (RDocumentation, n.d.).  The package which is required for this dataset is called “nutshell” in R.  The dataset contains 427,323 as shown below.  There are two Parts.  Part-I addresses five tasks to examine and understand the dataset using R before the analysis as follows:

Part-II address the analysis using R. Part-II includes seven tasks include the following. These seven tasks are followed by the discussion and analysis of the results. 

  • Task-1: The first five records of the dataset.
  • Task-2: The Number of Birth in 2006 per day of the week in the U.S.
  • Task-3: The Number of Birth per Delivery Method and Day of Week in 2006 in the U.S.
  • Task-4: The Number of Birth based on Birth Weight and Single or Multiple Birth Using Histogram.
  • Task-5: The Number of Birth based on Birth Weight and Delivery Method Using Histogram.
  • Task-6: Box Plot of Birth Weight Per Apgar Score.
  • Task-7: Box Plot of Birth Weight Per Day of Week.
  • Task-8: The Average of Birth Weight Per Multiple Births by Gender.
  • Task-9:  Discussion and Analysis.

Part-I:  Understanding and Examining the Dataset “births2006.smpl”

Task-1: Install Nutshell Package

The purpose of this task is to install the nutshell package which is required for this project. The births2006.smpl dataset is part of Nutshell package in R. 

  • Command: >install.packages(“nutshell”)
  • Command: >library (nutshell)

Task-2: Understand the Variables of the Dataset

The purpose of this task is to understand the variables of the dataset.  This dataset is part of RStudio dataset (RDocumentation, n.d.).  The main dataset is called “births2006.smpl” dataset, which includes thirteen variables as shown in Table 1. 

Table 1. The Variables of the Dataset of births2006.smpl.

This dataset contains information on babies born in the United in the year 2006.  The source of this dataset is (https://www.cdc.gov/NCHS/data_access/VitalStatsOnline.htm).  There is only one record per birth.  The dataset is a random ten percent sample of the original data (RDocumentation, n.d.).  The package which is required for this dataset is called “Nutshell” in R.  The dataset contains 427,323 as shown below. 

  • Command:> nrow(births.dataframe)

Task-3: Examine the Datasets Using R

The purpose of this task is to examine each dataset using RConsole. The commands which will primarily use in this section are a summary() to understand each dataset better.

  • Command: >summary(births2006.smpl),

Task-4: Create a Data frame to represent the dataset of births2006.smpl.

            The purpose of this task is to create a data frame for the dataset.

  • Command:  >births.dataframe <- data.frame(births2006.smpl)

Task-5: Examine the Content of the Data frame using head(), names(), colnames(), and dim() functions.

            The purpose of this task is to examine the content of the data frame using the functions of the head(), names(), colnames(), and dim().

  • Command:  head(births.dataframe)
    • Command: names(births.dataframe)Command: colnames(births.dataframe)Command:  >dim(births.dataframe)

Part-II: Birth Dataset Tasks and Analysis

Task-1: The First Five records of the dataset.

            The purpose of this task is to display the first five records using head() function.   

Task-2: The Number of Birth in 2006 per day of the week in the U.S.

The purpose of this task is to display a bar chart of the “frequency” of births according to the day of the week of the birth.  

Figure 1.  Frequency of Birth in 2006 per day of the week in United States.

Task-3: The Number of Births Per Delivery Method and Day of Week in 2006 in the U.S.

The purpose of this task is to show a bar chart of the “frequency” for two-way classification of birth according to the day of the week and the method of the delivery (C-section or Vaginal).

Figure 2.  The Number of Births Per Delivery Method and Day of Week in 2006 in the US.

Task-4: The Number of Birth based on Birth Weight and Single or Multiple Birth Using Histogram.

The purpose of this task is to use “lattice” (trellis) graphs using lattice R package, to condition density histograms on the value of a third variable. The variables for multiple births and the method of delivery are conditioning variables. Separate the histogram of birth weight according to these variables.  

Figure 3.  The Number of the Birth based on Weight and Single or Multiple Birth.

Task-5: The Number of Birth based on Birth Weight and Delivery Method Using Histogram.

The purpose of this task is to use “lattice” (trellis) graphs using lattice R package, to condition density histograms on the value of a third variable. The variables for multiple births and the method of delivery are conditioning variables. Separate the histogram of birth weight according to these variables.  

Figure 4.  The Number of the Birth based on Birth Weight and Delivery Method.

Task-6: Box Plot of Birth Weight Per Apgar Score

The purpose of this task is to use Box plot of birth weight against Apgar score and box plots of birth weight by day of the week of delivery. 

Figure 5.  Box Plot of Birth

Task-7: Box Plot of Birth Weight Per Day of the Week

The purpose of this task is to use Box plot of birth weight per day of the week.

Figure 6.  Box Plot of Birth Weight Per day of the Week.

Task-8: The Average of Birth Weight Per Multiple Births by Gender.

The purpose of this task is to calculate the average birth weight as a function of multiple births for males and females separately.  In this task, the tapply function is used, and the option na.rm=TRUE is used for missing values.

Figure 7.  Bar Plot of Average Birth Weight Per Multiple Births by Gender.

 Task-9: Discussion and Data Analysis

For the number of the births in 2006 per day of the week in United States, giving for Sunday (1) through the week until Saturday is (7), the result (Figure 1) shows that the highest number of births, which seems to be very close, happens in the working days of 3, 4, and 5, Tuesday, Wednesday, and Thursday respectively. The least number of birth is observed on day 1 (Sunday), followed by day 7 (Saturday), day 2 (Monday) and day 6 (Friday).  

For the number of births per delivery method for (C-section vs. vaginal), and the day of the week in 2006 in the United States, the result (Figure 2)  shows that the vaginal method is dominating the delivery methods and has the highest ranks in all weekdays in comparison with C-section.  The same high number of the birth per day in the vaginal method are the working days of Tuesday, Wednesday, and Thursday.  The least number of birth per day in the vaginal method is on Sunday, followed by Saturday, Monday, and Friday.   The highest number of birth in C-section is observed on Friday, followed by Tuesday through Thursday.  The least number of birth per day in C-section is still on Sunday, followed by Saturday and Monday. 

For the number of births based on birth weight and single or multiple births (twin, triplet, quadruplet, and quintuplet or higher), the result (Figure 3) shows that the single birth frequency has almost a normal distribution.  However, the more birth such as twin, triplet, quadruplet, and quintuplet or higher, the more distribution moves toward the left indicating less weight.  Thus, this result can suggest that the more birth (twin, triplet, quadruplet, and quintuplet or more) have lower birth rates on average. 

For the number of births based on the birth weight and delivery method, the result (Figure 4) shows that the vaginal and C-section have almost the same distribution.  However, the vaginal shows a higher percent total than the C-section.  The unknown delivery method is an almost the same pattern of distribution of vaginal and C-section.  More analysis is required to determine the effect of the weight on the delivery method and the rate of the birth. 

The Apgar score is a scoring system used by doctors and nursed to evaluate newborns one minute and five minutes after the baby is born (Gill, 2018).  The Apgar scoring system is divided into five categories: activity/muscle tone, pulse/heart rate, grimace, appearance, and respiration/breathing. Each category receives a score of 0 to 2 points.  At most, a child will receive an overall score of 10 (Gill, 2018). However, a baby rarely scores a 10 in the first few moments of life, because most babies have blue hands or feet immediately after the birth (Gill, 2018).  For the birth weight per Apgar score, the result (Figure 5) shows that the median is almost the same or close among the birth weight for Apgar score of 3-10.  The median for birth weight of Apgar score of 0 and 2 is close, while the least median is the Apgar score 1 within the same range of the birth weight of 0-2000 gram.  However, the birth weight from 2000-4000 gram, the median of the birth weight is close to each other for the Apgar score from 3-10, almost ~3000 gram.  The birth weight distribution varies, as it is more distributed between ~1500 to 2300 grams, the closer to Apgar score 10, the birth weight moves between ~2500 to ~3000 grams.  There are outliers in distribution for Apgar score 8 and 9.   These outliers show heavyweight babies above 6000 grams with Apgar score of 8-9.  As the Apgar score increases, the more outliers than the distribution of lower Apgar scores.  Thus, more analysis using statistical significance tests and effect size can be performed for further investigation of these two variables interaction. 

For the birth weight per day of the week, the result (Figure 6) shows that there is a normal distribution for the seven days of the week. The median of the birth weight for all days is almost the same.  The minimum, the maximum, and the range of the birth weight have also a normal distribution among the days of the week.  However, there are outliers in the birth weight for the working days of Tuesday, Wednesday, and Thursday.  There are additional outliers in the birth weight on Monday, as well as on Saturday but fewer outliers than the working days of Tues-Thurs.  This result indicates that there is no relationship between the birth weight and the days of the week, as the heavyweight babies above 6000 grams reflecting the outliers tend to occur with no regard to the days of the week. 

For the average of the birth weight per multiple births by gender, the result (Figure 7) shows that the single birth has the highest birth weight for the male and female of ~3500 grams.  The birth weight tends to decrease for “twin,” “triplet” for male and female.  However, the birth weight shows a decrease in the female and more decrease in male than female in “quadruplet.”  The more observed result is shown in the male gender babies as the birth weight gets increased for the “quintuplet or higher,” while the birth weight for female continues to decline for the same category of “quintuplet or higher.”  This result confirms the result of the impact of the multiple births on the birth weight as discussed earlier and illustrated in Figure 3.

In summary, the analysis of the dataset of births2006.smpl using R indicates that frequency of birth tends to focus more on the working days than the weekends, and the vaginal tends to dominate the delivery methods.  Moreover, the frequency of the birth based on birth weight and single or multiple births shows that the single birth has more normal distribution than the other multiple births.  The vaginal and C-section have shown almost similar distribution.  The birth weight per Apgar score is between ~2500-3000 grams and close among the Apgar score of 8-10.  The days of the week does not show any difference in the birth weight. Moreover, the birth weight per gender shows that the birth weight tends to decrease by multiple births among females and males, except only for the quintuplet, where it tends to decrease in a female while it increases in males.  This result of the increasing birth weight among male birth for quintuplet or higher requires more investigation to evaluate the reasons and causes for such an increase in the birth weight.  The researcher recommends further statistical significance, and the effect size tests verify these results.  

Conclusion

The project analyzed the selected dataset of the births2006.smpl.  The dataset is part of the R library “nutshell.” The project is divided into two main Parts.  Part-I evaluated and examined the dataset for understanding the Dataset using the R.  Part-I involved five major tasks for the examination of the dataset. Part-II addressed the Data Analysis of the dataset.  The Data Analysis involved nine major tasks.  The first eight tasks involved the codes and the results with Plot Graphs, and Bar Charts for analysis.   The discussion and the analysis were addressed in Task-9.  The most observed results showed that the number of the birth increases during the working days of Tuesday through Thursday over the weekend and the vaginal method is dominating over the C-section.  The result also showed that the average birth weight gets increased among the male babies for quintuplet while the trend continues to decline among the female babies. The researcher recommends further statistical significance, and the effect size tests to verify these results and examine the interaction among certain variables such as birth weight and Apgar score.

References

Gill, K. (2018). Apgar Score: What You Should Know. Retrieved from https://www.healthline.com/health/apgar-score#apgar-rubric.

RDocumentation. (n.d.). Births in the United States, 2006: births2006.smpl dataset. Retrieved from https://www.rdocumentation.org/packages/nutshell/versions/2.0/topics/births2006.smpl.


Machine Learning: Supervised Learning

Dr. Aly, O.
Computer Science

Introduction

The purpose of this discussion is to discuss the supervised learning and how it can be used in large datasets to overcome the problem where everything is significant with statistical analysis. The discussion also addresses the importance of a clear purpose of supervised learning and the use of random sampling.

Supervised Learning (SL) Algorithm

In accordance with the (Hall, Dean, Kabul, & Silva, 2014), SL “refers to techniques that use labeled data to train a model.”  It is comprised of “Prediction” (“Regression”) algorithm, and “Classification” algorithm.  The “Regression” or “Prediction” algorithm is used for “interval labels,” while the “Classification” algorithm is used for “class labels” (Hall et al., 2014).  In the SL algorithm, the training data represented in observations, measurements, and so forth are associated by labels reflecting the class of the observations (Han, Pei, & Kamber, 2011).  The new data is classified based on the “training set” (Han et al., 2011).

The “Predictive Modeling” (PM) operation of the “Data Mining” utilizes the same concept of the human learning by using the observation to formulate a model of specific characteristics and phenomenon (Coronel & Morris, 2016).  The analysis of an existing database to determine the essential characteristics “model” about the data set can implement using the PM operation (Coronel & Morris, 2016).  The (SL) algorithm develops these key characteristics represented in a “model” (Coronel & Morris, 2016).  The SL approach has two phases: (1) Training Phase, and (2) Testing Phase.  In the “Training Phase,” a model utilizing a large sample of historical data called “Training Set” is developed.  In the “Testing Phase,” the model is tested on new, previously unseen data, to determine the accuracy and the performance characteristics.  The PM operation involves two approaches: (1) Classification Technique, and (2) Value Prediction Technique (Connolly & Begg, 2015).  The nature of the predicted variables distinguish both techniques of the classification and value prediction (Connolly & Begg, 2015). 

The “Classification Technique” involves two specializations of classifications: (1) “Tree Induction,” and (2) “Neural Induction” which are used to develop a predetermined class for each record in the database from a set of possible class values (Connolly & Begg, 2015).  The application of this approach can answer questions like “What is the probability for those customers who are renting to be interested in purchasing home?” 

The “Value Prediction,” on the other hand, implements the traditional statistical methods of (1) “Linear Regression,” and (2) “Non-Linear Regression” which are used to estimate a continuous numeric value that is associated with a database record (Connolly & Begg, 2015).  The application of this approach can be used for “Credit Card Fraud Detection,” and “Target Mailing List Identification” (Connolly & Begg, 2015).  The limitation of this approach is that the “Linear Regression” works well only with “Linear Data” (Connolly & Begg, 2015). The application of the PM operation includes the (1) “Customer Retention Management,” (2) “Credit Approval,” (3) “Cross-Selling,” and (4) “Direct Marketing” (Connolly & Begg, 2015).  Furthermore, the Supervised methods such as Linear Regression or Multiple Linear Regression can be used if there exists a strong relationship between a response variable and various predictors (Hodeghatta & Nayak, 2016).   

Clear Purpose of Supervised Learning

The purpose of the supervised learning must be clear before the implementation of the data mining process.   Data mining process involves six steps in accordance to (Dhawan, 2014).  They are as follows. 

  • The first step includes the exploration of the data domain.  To achieve the expected result, understanding and grasping the domain of the application assist in accumulating better data sets that would determine the data mining technique to be applied. 
  • The second phase includes the data collection.  In the data collection stage, all data mining algorithms are implemented on some data sets.  
  • The third phase involves the refinement and the transformation of the data.  In this stage, the datasets will get more refined to remove any noise, outliner, missing values, and other inconsistencies.  The refinement of the data is followed by the transformation of the data for further processing for analysis and pattern extraction.  
  • The fourth step involves the feature selection.  In this stage, relevant features are selected to apply further processing. 
  • The fifth stage involves the application of the relevant algorithm.  After the data is acquired, cleaned and features are selected, in this step, the algorithm is selected to process the data and produce results.  Some of the commonly used algorithms include (1) clustering algorithm, (2) association rule mining algorithm, (3) decision tree algorithm, and (4) sequence mining algorithm. 
  • The last phase involves the observation, the analysis, and the evaluation of the data.  In this step, the purpose is to find a pattern in the result produced by the algorithm.  The conclusion is typically based on the observation and evaluation of the data.

Classification is one of the data mining techniques.  Classification based data mining exists as the cornerstone of the machine learning in artificial intelligence (Dhawan, 2014).  The process in the Supervised Classification begins with given sample data, also known as a training set, consists of multiple entries, each with multiple features.  The purpose of this supervised classification is to analyze the sample data and to develop an accurate understanding or model for each class using the attributes present in the data.  This supervised classification is used to classify and label test data.  Thus, the precise purpose of the supervised classification is very critical to analyze the sample data and develop an accurate model for each class using the attributes present in the data.  Figure 1 illustrates the supervised classification technique in data mining as depicted in (Dhawan, 2014).  

Figure 1:  Linear Overview of steps involved in Supervised Classification (Dhawan, 2014)

The conventional techniques employed in the Supervised Classification involves the known algorithms of (1) Bayesian Classification, (2) Naïve Bayesian Classification, (3) Robust Bayesian Classifier, and (4) Decision Tree Learning. 

Various Types of Sampling

A sample of records can be taken for any analysis unless the dataset is driven from a big data infrastructure (Hodeghatta & Nayak, 2016).  A randomization technique should be used, and steps must be taken to ensure that all the members of a population have an equal chance of being selected (Hodeghatta & Nayak, 2016). This method is called probability sampling.  There are various variations on this sampling type:  Random Sampling, Stratified Sampling, and Systematic Sampling (Hodeghatta & Nayak, 2016), cluster, and multi-stage (Saunders, 2011).  In Random Sampling, a sample is picked randomly, and every member has an equal opportunity to be selected. In Stratified Sampling, the population is divided into groups, and data is selected randomly from a group or strata.  In Systematic Sampling, members are selected systematically, for instance, every tenth member of that particular time or event (Hodeghatta & Nayak, 2016).  The most appropriate sampling technique to obtain a representative sample should be implemented based on the research question(s) and the objectives of the research study (Saunders, 2011). 

In summary, supervised learning is comprised of Prediction or Regression, and Classification. In both approaches, a clear understanding of the SL is critical to analyze the sample data and develop an accurate understanding or model for each class using the attributes present in the data.  There are various types of sampling:  random, stratified and systematic.  The most appropriate sampling technique to obtain a representative sample should be implemented based on the research question(s) and the objectives of the research study. 

References

Connolly, T., & Begg, C. (2015). Database Systems: A Practical Approach to Design, Implementation, and Management (6th Edition ed.): Pearson.

Coronel, C., & Morris, S. (2016). Database systems: design, implementation, & management: Cengage Learning.

Dhawan, S. (2014). An Overview of Efficient Data Mining Techniques. Paper presented at the International Journal of Engineering Research and Technology.

Hall, P., Dean, J., Kabul, I. K., & Silva, J. (2014). An Overview of Machine Learning with SAS® Enterprise Miner™. SAS Institute Inc.

Han, J., Pei, J., & Kamber, M. (2011). Data mining: concepts and techniques: Elsevier.

Hodeghatta, U. R., & Nayak, U. (2016). Business Analytics Using R-A Practical Approach: Springer.

Saunders, M. N. (2011). Research methods for business students, 5/e: Pearson Education India.