"Artificial Intelligence without Big Data Analytics is lame, and Big Data Analytics without Artificial Intelligence is blind." Dr. O. Aly, Computer Science.
The purpose of this discussion is to discuss and analyze the data privacy and governance as they relate to the healthcare industry. The discussion also addresses the privacy violations, approaches to avoid them, and the best practices which healthcare industry could adapt to avoid instances of data breach and privacy violation.
Data Privacy and Governance
The privacy protections of users’ information depend on the capabilities of the technology adopted to extract, analyze, and correlate potentially sensitive dataset. In the age of Big Data and the emerging technologies to deal with Big, protecting the privacy is becoming more challenging than before. The development of Big Data tools requires security measures and safeguards to protect the privacy of the users and the patients in the healthcare industry in particular. Moreover, the data which gets used for the analytical purpose may include regulated information or intellectual property. Thus, the Big Data professionals must comply with the regulations to ensure the appropriate data use and protection (CSA, 2013).
With respect to privacy, various legislative and regulatory compliance
issues. Many US regulations include
privacy requirements such as Health Insurance Portability and Accountability
Act (HIPAA), the Sarbanes-Oxley Act of
2002 (SOX), the Gramm-Leach-Bliley Act.
When privacy is violated, the
individuals and organizations must be informed.
Otherwise, legal ramifications will be
enforced. The issues of privacy must be
addressed when allowing or restricting personal use of email, retaining
email, recording phone conversation, gathering information about surfing or
spending habits, and so forth (Stewart, Chapple, &
Gibson, 2015).
Data Breach and Privacy Violation in Healthcare
In accordance to a recent report published by HIPAA, the first three months of 2018 experienced 77 healthcare data breaches reported to the Department of Health and Human Services’ Office for Civil Rights (OCR). The report added that the impact of these breaches was significant as more than one million patients and health plan members were affected. These breaches are estimated to be almost twice the number of individuals who were impacted by healthcare data breaches in Q4 of 2017. Figure 1 illustrates such increasing trend in the Healthcare Data Breaches (HIPAA, 2018).
Figure 1: Q1, 2018 Healthcare Data Breaches (HIPAA, 2018).
As reported in the same report, the healthcare industry is unique with respect to the data breaches because they are caused mostly by the insiders; “insiders were behind the majority of breaches” (HIPAA, 2018). Other reasons involve improper disposal, loss/theft, unauthorized access/disclosure incidents, and hacking incidents. The largest healthcare data breaches of Q1 of 2018 involved 18 healthcare security breaches which impacted more than 10,000 individuals. The hacking/IT incidents involved more records than any other breach cause as illustrated in Figure 2 (HIPAA, 2018).
Figure 2. Healthcare Records Exposed by Breach Cause (HIPAA, 2018).
The worst affected by the healthcare
data breaches in Q1 of 2018 involved the healthcare providers. With respect
to the states, California was the worst affected state with 11 reported
breaches and Massachusetts with eight
security incidents.
Best Practice
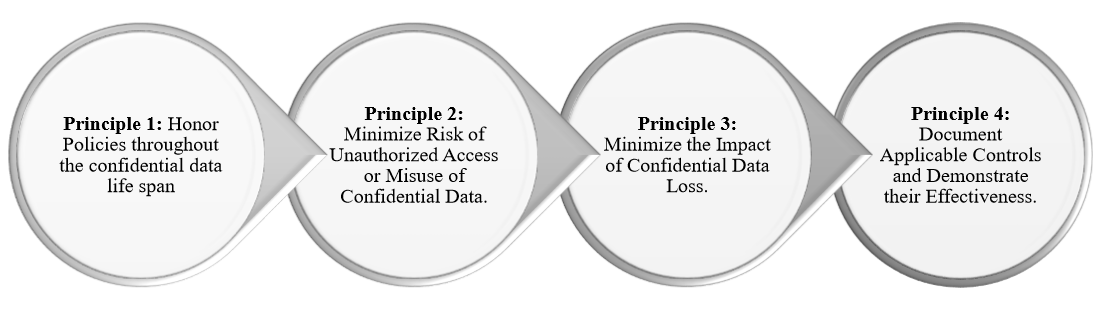
Organizations must follow four main principles to select technologies and activities which will protect their confidential data assets. The first principle includes the policies which must be honored by the organization throughout the confidential data lifespan. Organizations should commit to process all data by the regulations and laws, protecting users and patients private information and employ transparency to allow them to correct their information. The second principle involves the risk of unauthorized access or misuse of confidential information, which should be minimized by organizations. Organizations should establish a security system to provide administrative, technical and physical security measures to ensure the CIA Triad elements of Confidentiality, Integrity, and Availability of the data. The third principle involves the impact of the confidential data loss. Organizations must establish a protection system to minimize the impact of stolen or lost data by providing reasonable safeguards for the data in storage and transit, such as encryptions to ensure the confidentiality of the data in case of loss or stolen. Organizations must develop an appropriate plan to respond to data breach effectively and provide training to all involved employees. The last principle involves the documentation of the applicable controls and the demonstration of their effectiveness. Organizations must verify the effectiveness of these principles implementations using the appropriate monitoring, auditing, and control systems. Moreover, organizations must establish an appropriate system for the non-compliance and the escalation path (Salido, 2010). Figure 3 summarizes these four principles which organizations must adhere to ensure the compliance with the CIA Triad.
Figure 3: Four Principles for Data Privacy and Confidentiality. Adapted from (Salido, 2010).
In summary, organizations including
healthcare must adhere to the data privacy regulations and legislative rules
carefully to protect the users and patients from data breaches. Organizations must commit to this four principles for data privacy and
confidentiality. Organizations including
healthcare must implement the proper security policy and risk management to
ensure the protection of private information as well as to minimize the impact
of confidential data in case of loss or theft.
References
CSA, C. S. A. (2013). Big Data Analytics
for Security Intelligence. Big Data
Working Group.
The purpose of this discussion is to discuss and analyze the role of the Data Brokers in the healthcare industry. This discussion begins with the dark side of the Big Data industry, followed by the Data Broker business, and a discussion of some use cases in Data Broker in healthcare.
The Dark Side of Big Data Industry
Big Data Analytics provide various benefits to organizations and businesses in various areas. With respect to healthcare, as indicated in (Wang, Kung, & Byrd, 2018), the benefits of Big Data covers various areas such IT infrastructure benefits, organizational benefit, managerial benefits and strategic benefits. In IT infrastructure, the healthcare organization can benefit from reducing system redundancy, avoiding unnecessary IT costs, transferring data quickly among healthcare IT systems, and better use of healthcare system. The organizational benefits of Big Data analytics in healthcare organization include a reduction in surgery-related hospitalization, improving the quality and accuracy of a clinical decision, and reducing the diagnosis time. The managerial benefits of Big Data analytics include gaining insights quickly about changing healthcare trends in the market, optimizing business-related decision and fraud detection. Strategic benefits of Big Data in healthcare organizations include the development of highly competitive healthcare services. Thus, the utilization of Big Data Analytics makes a difference in healthcare organizations in particular, and in all businesses in general.
However, there is a dark side to Big Data. As indicated in (Martin, 2015), there are
ethical issues in the Big Data industry.
Big Data is about information from various sources to create knowledge,
make better predictions and tailor services.
The ethical issues are coming from reselling the data of the consumers
to the secondary market for Big Data. Examples
of these ethical issues include the Data Broker.
Data
Broker Business: Data
Broker is defined in (Gartner, n.d.) as follows:
“A Data Broker
is a business that aggregates information from a variety of sources; processes
it to enrich, cleanse or analyze it; and licenses it to other organizations.
Data Brokers can also license another company’s data directly, or process
another organization’s data to provide them with enhanced results. Data is typically accessed via an application
programming interface (API) and
frequently involves subscription type contract. Data typically is not ‘sold’
(i.e., its ownership transferred), but rather it is licensed for particular or
limited uses. (A data broker is also sometimes known as information broker,
syndicated data broker, or information product company.)”
Big Data Means Big Business to Data Brokers: Use Cases in Healthcare: As discussed in (Tanner, 2016), Data Brokers make money off the patients’ medical records. The patients’ identity by law should be kept in a secure place for privacy protection. Organizations which sell medical information to data mining companies strip the private information of the patients such as social security, names and detailed addresses to protect the identity of the patients (Tanner, 2016). However, the Data Brokers add unique numbers to each record they collect which allow them to match disparate pieces of information to the same individual even if they do not know the patient’s name. Such matching information makes the information more valuable to the Data Brokers (Tanner, 2016). As indicated in (Hill, 2013), Data Brokers are making money by selling lists of rape victims, alcoholics, and patients with AIDS/HIV, and hundreds of other illnesses. There are about four thousand Data Broker. There are 320 Million people in the U.S who cannot escape from Data Brokers business. Moreover, Data Broker and Pharmacies such as Walgreen commercialize the medical data (Leetaru, 2018).
In summary, although Big Data has tremendous benefits to
organizations in many industries including healthcare industry, across the
board, there is a major concern about the privacy of people including the
patients in the healthcare industry. More regulations must be enforced to protect
the privacy of people from the hands of businesses such as Data or Information
Broker. As indicated in (Slater, 2014), “The debate
surrounding how to regulate big data is set to continue, both within the data
broker context and beyond.”
Wang,
Y., Kung, L., & Byrd, T. A. (2018). Big data analytics: Understanding its
capabilities and potential benefits for healthcare organizations. Technological Forecasting and Social Change,
126, 3-13.
The purpose of this discussion is to present a case study where Big Data Analytics was used to detect fraudulent data in the healthcare industry. The discussion also discusses and analyze the case study and how the Big Data Analytics can be used to eliminate or mitigate fraud in the healthcare industry.
Healthcare Fraud is Reality
Healthcare industry is valued at $2.7 trillion industry in the United States alone. One-third of this value is lost due to various waste, fraud, and abuse. The common examples for the fraud and abuse in healthcare include illegal medical billing for falsified claims, multiple claims filed by multiple providers, and stolen identity of the patients to gain reimbursement for medical service never provided. There is an estimation of fraudulent billing of 3-10% of the annual healthcare costs in the US (Halyna, 2017). As indicated in (Travaille, Mueller, Thornton, & J., 2011), there is an estimation between $600 and $850 billion annually is lost in fraud, waste, and abuse in the healthcare system in the U.S., out of which $125 to $175 billion is due to fraudulent activities. Example of the magnitude of the Healthcare Fraud is the Medicare fraud scheme for a Texas doctor who netted nearly $375 million. The fraud included $350 million for Medicare, and more than $24 million for Medicaid (medicarefraudcenter.org, 2012). Thus, the healthcare fraud is an intentional deception which is used by the medical practitioners to obtain unauthorized benefits (Joudaki et al., 2015). Frauds are categorized as criminal activities and must be detected and stopped. As indicated in (Rashidian, Joudaki, & Vian, 2012), combatting the fraud in healthcare industry remains a challenge.
Thus, there is a serious need for effective fraud
detection and prevention in the healthcare
industry. Big Data Analytics plays a
significant role in the fraud detection in the healthcare
industry. As indicated in (Hitchcock, 2018) “Big data has
massively transformed the healthcare industry in so many ways, contributing
largely to today’s more efficient value-based healthcare system.” Various
research studies showed that Big Data Analytics and Data Mining could be used effectively in fraud
detection. For example, in the research
study of (J. Liu et al., 2016), the researchers
used the graph analysis for detecting
fraud, waste, and abuse in healthcare
data. In (Bresnick, 2017), machine learning
and Big Data Analytics are helping Anthem improve member engagement and detect
fraud, waste, and abuse. In (Suleiman, Agrawal, Seay, & Grosky, 2014), Big Data is used
to filter fraudulent Medicaid applications.
Case Study In Health Insurance
This case study is based on (Nelson, 2017). The health insurance company was using the traditional technique in fraud detection. The traditional technique in fraud investigation relied on executing SQL queries using data warehouse which stores massive amounts of claims, billings, and other information. This process was taking weeks or months before enough evidence for a legal case was developed. The time for fraud increases the losses of the organization.
The health insurance utilized Big Data techniques such
as Predictive Analytics and Machine Learning for fraud detection. The integration of Big Data and search
architecture was proven to be the most feasible approach for fraud
detection. Figure 1 illustrates the Big
Data architecture for fraud detection utilized by the healthcare insurance
company. This Big Data framework enabled
the fraud detection effort to be more scalable, faster, and more accurate.
Figure 1. Big Data Analytics Architecture for Fraud Detection (Nelson, 2017).
As a result of the integration of Big Data into the
fraud detection system of the health insurance, the company experienced an immediate return on investment by saving $150
million used to prosecute large fraud cases.
The advantages of the integration of Big Data into the fraud detection
also include the analysis of 10+ million claims, 100+ million of bill line
details, and related record. The
framework also provided more accurate information by computing key fraud
indicators and providing automatic red flag datasets
for suspicious activities and leveraging
all records and not just a statistical sample.
Big Data Analytics Integration and Impact in Fraud Detection in Healthcare
Many organizations have employed Big Data and Data Mining in some areas including fraud detection. Big Data Analytics can empower healthcare industry in fraud detection to mitigate the impact of the fraudulent activities in the industry. Several use cases such as (Halyna, 2017; Nelson, 2017) have demonstrated the positive impact of integrating Big Data Analytics into the fraud detection system.
Big Data Analytics and Data Mining have various
techniques such as classification model, regression model, and clustering
model. The classification model employs
logistic, tree, naïve Bayesian, and neural network algorithms. It can be used
for fraud detection. The regression model employs linear ad
k-nearest-neighbor. The clustering model
employs k-means, hierarchical and principal component algorithms.
For instance, in (Q. Liu & Vasarhelyi, 2013), the researchers
applied the clustering technique using unsupervised data mining approach to
detect the fraud of insurance subscribers.
In (Ekina, Leva, Ruggeri, & Soyer, 2013), the researchers applied the Bayesian co-clustering
with unsupervised data mining method to detect conspiracy fraud which involved
more than one party. In (Capelleveen, 2013), the researchers
employed the outlier detection technique using unsupervised data mining method
to detect dental claim data within Medicaid.
In (Aral, Güvenir, Sabuncuoğlu, & Akar, 2012), the researchers
used distance-based correlation using
hybrid supervised and unsupervised data mining methods for prescription fraud
detection. These research studies and use cases are
examples of taking advantages of Big Data
Analytics in healthcare fraud detection.
Thus, it is proven that Big Data
Analytics can play a significant role in healthcare fraud detection.
References
Aral, K. D., Güvenir, H. A.,
Sabuncuoğlu, İ., & Akar, A. R. (2012). A prescription fraud detection
model. Computer methods and programs in
biomedicine, 106(1), 37-46.
Joudaki, H.,
Rashidian, A., Minaei-Bidgoli, B., Mahmoodi, M., Geraili, B., Nasiri, M., &
Arab, M. (2015). Using data mining to detect health care fraud and abuse: a
review of the literature. Global journal
of health science, 7(1), 194.
Liu, J., Bier,
E., Wilson, A., Guerra-Gomez, J. A., Honda, T., Sridharan, K., . . . Davies, D.
(2016). Graph analysis for detecting fraud, waste, and abuse in healthcare
data. AI Magazine, 37(2), 33-46.
Liu, Q., &
Vasarhelyi, M. (2013). Healthcare fraud
detection: A survey and a clustering model incorporating Geo-location
information.
Suleiman, M.,
Agrawal, R., Seay, C., & Grosky, W. (2014). Data-driven implementation to filter fraudulent Medicaid applications.
Paper presented at the SOUTHEASTCON 2014, IEEE.
The
purpose of this project was to articulate all the steps for the installation
and configuration of OpenStack and Amazon Web Services. The project begins with an overview of
OpenStack. It is divided into three main phases.
The first Phase discusses and analyzes the differences between the
Networking techniques in AWS and OpenStack.
Phase 2 discusses the required configurations to deploy the OpenStack Controller. Phase 2 also discusses and analyzes the
expansion of OpenStack to include additional node as the Compute node. Phase 3 discusses the issues encountered
during the installation and configuration of OpenStack and AWS services. A
virtual bridge for the provider network was
configured where all VMs traffic reaches the Internet through the
external bridge. The floating IP also
must be disallowed to avoid dropping the packet when they reach AWS. In this project, OpenStack using the
Controller Node and an additional Compute Node is deployed and accessed
successfully using Horizon dashboard.
Elastic Cloud Compute (EC2) is also installed and configured
successfully using the default VPC, the default Security Group and Access
Control List.
OpenStack is a result of initiatives from Rackspace and NASA in 2010 because NASA could not store its data in the Public Cloud for security reasons. OpenStack is an open source project which can be utilized by leading vendors to bring AWS-like ability and agility to the private cloud. OpenStack has been growing since its inception in 2010 to include 500 member companies as part of the OpenStack Foundation with platinum and gold members from the largest IT vendors globally. Examples of these platinum members include RedHat, Suse, IBM, Hewlett Packard Enterprise, Ubuntu, AT&T and Rackspace (Armstrong, 2016).
OpenStack provides primarily an
Infrastructure-as-s-Service (IaaS) function within the Private cloud, where it
makes centralized storage, commodity computes,
and networking features available to end users to self-service their needs,
through the Horizon dashboard or a set of common APIs. Many organizations are deploying OpenStack
in-house to develop their own data centers.
The implementation of the OpenStack is less likely to fail when
utilizing professional service support from known vendors and can create
alternative solutions to Microsoft Azure and AWS. Examples of these professional service
vendors include Red Hat, Suse, HP, Canonical, Mirantis, and so forth. They provide different methods of installing
the platform (Armstrong,
2016).
The release cycle of the OpenStack
is six months during which an upstream release is
created. OpenStack Foundation
creates the upstream release and governs it.
Example of the public cloud deployment of OpenStack includes AT&T, RackSpace, and GoDaddy.
Thus, OpenStack is not exclusively used
for private cloud. However, OpenStack
has been increasingly popular as a Private Cloud alternative to AWS Public
Cloud. OpenStack is now widely used for Network Function Virtualization (NFV) (Armstrong,
2016).
OpenStack
and AWS utilize different approaches to Networking. This section begins with AWS Networking,
followed by OpenStack Networking.
Virtual Private Cloud (VPC) is a hybrid cloud comprising of public and private clouds. The VPC is the default setting for new AWS users. The VPC can also be connected to a network of users or the private data center of the organization. The underlying concept of connecting the VPC to the private data center of the organization is the use of the gateway and virtual private cloud gateway (VPG). The VPG is two redundant VPN tunnels, which gets instantiated from the private network of the user or the organization. The gateway of the organization exposes a set of external static addresses from the site of the organization, which are using Network Address Translation-Traversal (NAT-T) to hide the address. The organization can use one gateway device to access multiple VPCs. The VPC provides an isolated view of all provisioned instances. Identity and Access Management (IAM) of AWS is used to set up user account to access the VPC. Figure 1 illustrates an example of the AWS VPC with virtual machines or instances mapped with one or more security groups and connected to different subnets connected to the VPC router (Armstrong, 2016; AWS, 2017).
Figure 1. VPC of AWS showing multiple instances using Security Group.
The networking is simplified by VPC using software and allowing users and organizations to perform a certain set of networking operations such as mapping the subnet, using Domain Name System (DNS), Public and Private IP addresses assignments, security group and access control list application. When organizations create a virtual machine or instance, a default VPC is assigned to it automatically. All VPC comes with a default router which can have additional custom routes and the routing priority to forwarding traffic to specific subnets based on the requirements of the organizations and users. Figure 2 illustrates VPC using Private IP, Public IPs, and the Main Route Table, adapted from (Armstrong, 2016; AWS, 2017).
Figure 2. AWS VPC Configuration Example (AWS, 2017).
With respect to the IP Addressing of
AWS, a mandatory private IP is assigned automatically to every virtual machine
or instance, also a public IP and DNS entry unless the instance is a dedicated
instance. The Private IP is used to
route traffic among instances when there is a need for a virtual machine to
communicate with another virtual machine that is close to it on the same
subnet. The Public IP, on the other
hand, are accessible through the Internet.
If there is a need for a persistent Public IP address for a virtual
machine, the Elastic IP addressed feature is provided by AWS which is limited
to five per VPC account only. When using
Elastic IP addresses, the IP address can be mapped quickly to another instance
in case of a failure of the instance.
When using AWS, it can take up to 24 hours for the DNS Time to live
(TTL) of a Public IP address to propagate.
Moreover, AWS supports a Maximum Transmission Unit (MTU) of 1,500 regarding
throughput which can be passed to an instance in AWS. The organization must consider this feature
for application performance consideration (Armstrong,
2016; AWS, 2017).
AWS uses Security Groups and Access
Control Lists. The SG in AWS is used to
group a collection of access control rules with implicit denies. The SG in AWS can be associated with one or
more network interfaces of instances.
The SG acts as the firewall for the instances. There is a default SG which gets applied
automatically if no other security group is specified with the instantiated
instance. The default SG allow all
outbound traffic and all inbound traffic only from other instances within the
same VPC. The default SG group cannot be
deleted. With the custom SG, no inbound
traffic, but all outbound traffic allowed. The user can add Access Control List (ACL)
rules are associated with the SG governing the inbound traffic using AWS
console (Armstrong,
2016; AWS, 2017).
The VPC of AWS ha access to
different regions and availability zone of shared computer dictating the data
center which the instance and virtual machine will be deployed in. The availability zone AZ is an isolated
location residing in a region which is a geographic area isolated by
design. Thus, AZ can be a subset of a region. Organizations and users can place resources
in different locations for redundancy for recovery consideration. AWS supports the use of more than one AV when
deploying production workloads on AWS. Moreover,
organizations and users can replicate the instances and data across regions (Armstrong,
2016; AWS, 2017).
Elastic Load Balancing (ELB) feature
is also offered by AWS, which can be configured within a VPC. The
ELB can be external or internal. When
the ELB is external, it allows the creation of the internet-facing entry point
into the VP using an associated DNS entry and balances load among the instances
in the VPC. The SG is assigned to the
ELB to control the access to ports which need to be used (Armstrong,
2016; AWS, 2017).
OpenStack is deployed in a data
center on multiple controllers. These
controllers contain all services of the OpenStack. These controllers can be installed
on virtual machine, bare metal physical servers, or containers. When these controllers get deployed in a production
environment, they host all OpenStack services in a high availability and
redundancy platform. Different
installers to install OpenStack are offered by different OpenStack vendors. Examples of these installers include RedHat
Director, Mirantis Fuel, HPs HPE installed, and Juju for Canonical. All these
installers install controllers. They are
also used to scale out compute nodes on the OpenStack cloud (Armstrong,
2016; OpenStack, 2018b).
With respect to the services of the OpenStack, there are eleven core services which are installed on the OpenStack controlled. These core services include Keystone, Heat, Glance, Cinder, Nova, Horizon, Rabbitmq, Galera, Swift, Ironic and Neutron. Figure 3 summarizes each core service of the OpenStack (OpenStack, 2018a). The Neutron architecture is similar in constructs to AWS regarding Neutron Networking services (Armstrong, 2016; OpenStack, 2018b).
Figure 3. Summary of OpenStack Core Services (OpenStack, 2018a)
In
OpenStack, a Project is referred to as a Tenant providing an isolated view of everything
which a team has provisioned in the OpenStack cloud. Using the Keystone Identity service,
different users can be set up for a Project (Tenant). These accounts can be integrated with LDAP
such as Active Directory to support customizable permission model (Armstrong,
2016; OpenStack, 2018b).
The
Neutron Service of OpenStack performs all networking related tasks and
functions. These functions and tasks
include seven major steps. The first step includes the creation of instances or
virtual machine mapped to networks. The
second step includes the assignment of IP addresses using the built-in DHCP
service. The third step includes the
application of DNS entries to instances from named servers. The fourth step includes the assignment of
Private and Floating IP addressed. The
fifth step incluse the creation or the associatoiin of the network subnet,
followed by creating the routers. The
last step is the application of the Security Groups (Armstrong,
2016; OpenStack, 2018b).
The
compute nodes of the OpenStack are deployed using a Hypervisor which uses Open
vSwitch. Most vendor distributions of
OpenStack provide KVM Hypervisor by default, which gets deployed and configured
on each computes node by the OpenStack Installer. The compute nodes in OpenStack are connected
to the access layer of the STP 3-tier model. In modern networks, they are
connected to the Leave switches, with VLANs connected to each computes node in
the OpenStack cloud. The networks of the
Tenant are used to provide isolation among tenants and use VXLAN and GRE
tunneling to connect the layer two network (Armstrong,
2016; OpenStack, 2018b).
The
configuration and setup of simple networking using Neutron in a Project
(Tenant) network requires two different networks; an internal network and an
external network. The internal network is
used for traffic among instances in the Project, where the subnet name and
range are specified in the Subnet. The
external network is used to make the internal network accessible from outside
of the OpenStack. A router is also used
in OpenStack to route packets to the network, which will be associated with the
networks. The external network needs to be
set as the router’s gateway. The last
step in the network configuration connects one router to an internal and
external network. Instances are
provisioned in OpenStack onto the internal Private Network by selecting the
Private Network NIC during the deployment of the instance. OpenStack assigns pools of Public IPs known
as Floating IP addresses from an external network for instances which need to
be externally routable outside of the OpenStack (Armstrong,
2016; OpenStack, 2018b).
OpenStack
uses SG like AWS to set up firewall rules between instances. However, OpenStack, unlike AWS, supports both
ingress and egress ACL rules, whereas AWS allows all outbound communications. OpenStack can work with both ingress and
egress rules. SSH access must be
configured as an ACL rule against the parent SG in OpenStack which is pushed
down to Open vSwitch into kernel space on each Hypervisor. When the internal and external networks are set
up and configured for the Project (Tenant), instances are ready to be launched
on the Private network. Users can access
the instance from Horizon dashboard (Armstrong,
2016; OpenStack, 2018b).
With
respect to regions and availability zones in OpenStack, like AWS, OpenStack
uses regions and AZ. The compute nodes
in OpenStack (Hypervisors) can be assigned to different AZ, which is a virtual
separation of computing resources. The
AZ in OpenStack can be segmented into host aggregated. However, a compute node
can be assigned to only one AZ in OpenStack, while it can be a part of multiple
host aggregates in the same AZ (Armstrong,
2016; OpenStack, 2018b).
OpenStack
offers Load-Balancer-as-a-Service (LBaaS) which allows incoming requests to be
distributed evenly among the designated instances using a Virtual IP (VIP). Examples of the popular LBaaS plugins in OpenStack
include Citrix NetScaler, F5, HaProxy, and Avi networks. The underlying concept of LBaaS on OpenStack
is to allow organizations and users to use LBaaS as a broker to the load
balancing solutions, using APIs of the OpenStack or using the Horizon dashboard
to configure the Load Balancer (Armstrong,
2016; OpenStack, 2018b).
This project deployed OpenStack on AWS and limited to the configuration of the controller node. In the same project, the OpenStack cloud is expanded to add a compute node. The topology for this project is illustrated in Figure 4. Port 9000 will be configured to be accessed from the browser on the client. The Compute Node VM will be using a different IP address than that IP address for the OpenStack Node. A Private Network will be configured using the Vagrant software. NAT interface will be configured and mapped to the Compute Node and the OpenStack Controller Node as illustrated in Figure 4.
Figure 4. This Project’s Topology.
The
Controller Node is configured to have one processor, 4 GB memory, and 5 G storage. The Compute Node is configured to have one
processor, 2 GB memory, and 10 GB storage.
The installation must be performed on a 64bit version of distribution on
each node. VirtualBox is used in this
project. The Vagrant software is also
used in this project. Another software
called Sublime Text is installed to configure the Vagrant file and avoid any
control characters at the end of each line which can cause problems. The project is using the Pike release.
The
project requires AWS account, to select
the image which can be used for OpenStack
Deployment. Multi-Factor Authentication
is implemented to access the account. Amazon
Machine Image (AMI) Elastic Compute Cloud (EC2) is
selected from the pool of the AMIs for this project. The Free Tier EC2 instance is configured with the default Security Group (SG)
and Access Control List (ACL) rules as discussed earlier. EC2 AMI is a template which contains the
software configuration such as operating system, application server, and applications required to launch and
instantiate the instance. The EC2 AMI is
configured to use the default VPC.
The Controller Node is configured first to use the IP Address identified in the topology. This configuration is implemented using Vagrant software and Vagrant file.
Connect to the controller using the Vagrant software. To start the Controller from Vagrant, execute:
$vagrant up the controller.
Verify the Controller is running successfully.
$vagrant status
Verify the NAT address using eth0.
$ifconfig -a
Verify the Private IP Address using eth1. The IP address shows the same IP address configured in the configuration file.
Access the Controller Node of the OpenStack from the Browser using the Port 9000.
The
OpenStack Cloud is expanded by adding a Compute Node. The configuration of the compute node is
performed using the Vagrant file.
Connect to the computer using Vagrant command. The Compute Node is using node1 as the
hostname. To start the Compute Node from
Vagrant, execute the following command:
$vagrant up node1.
Verify the Compute Node is running
successfully.
$vagrant status
Access
node1 using SSH.
Check OpenStack Services:
$sudo systemctl
list-units devstack@*
Verify the NAT address using eth0.
$ifconfig -a
Verify the Private IP Address using
eth1. The IP address shows the same IP
address configured in the configuration file.
Access
the Controller Node of the OpenStack from the Browser using the Port 9000. Verify the Hypervisors from Horizon
interface.
There
are some issues encountered during the deployment of OpenStack on AWS. The issue which impacted EC2 AMI involved the
MAC address which must be registered in
the AWS network environment. Moreover,
the MAC address and the IP address must be mapped together because the packets
will not be allowed to flow if the MAC address and the IP address are
different.
During
the configuration of the OpenStack Neutron Networking, a virtual bridge for the
Provider Network is configured where all
VMs traffic will reach the Internet through the external bridge which is
followed by the actual physical NIC of eth1.
Thus, NIC with a special type of configuration
will be configured as the external interface as shown in the topology for this
project (Figure 4).
The floating IP must be disabled because it will send the
packet through the router’s gateway with the IP address as a floating IP
address, which will result in dropping the packets once they reach AWS because
they will reach the switch with no registered IP and MAC address. In this project, the NAT is configured to access
the public address externally as shown in the topology in Figure 4.
The
purpose of this project was to articulate all the steps for the installation
and configuration of OpenStack and Amazon Web Services. The project began with an overview of
OpenStack. It is divided into three main phases.
The first Phase discussed and analyzed the differences between the
Networking techniques in AWS and OpenStack.
Phase 2 discussed the required configurations to deploy the OpenStack Controller. Phase 2 also discussed and analyzed the
expansion of OpenStack to include additional node as the Compute node. Phase 3 discussed the issues encountered
during the installation and configuration of OpenStack and AWS services. A
virtual bridge for the provider network was
configured where all VMs traffic reaches the Internet through the
external bridge. The floating IP also
must be disallowed to avoid dropping the packet when they reach AWS. In this project, OpenStack using the
Controller Node and an additional Compute Node was deployed and accessed
successfully using Horizon dashboard.
Elastic Cloud Compute (EC2) was also installed and configured
successfully using the default VPC, the default Security Group, and Access Control List.
The purpose of this discussion is to discuss and analyze the use of the Cloud Computing technology in the healthcare industry. It also discusses and analyzes the present issue related to healthcare data in the Cloud, advantages, and disadvantages of having the data into the Public and Private Cloud. The discussion also provides a use case scenario.
Healthcare in Cloud Computing
As indicated in (Chen & Hoang, 2011), the healthcare industry is moving slowly toward the Cloud Computing technology due to the sensitive nature of the healthcare data. There is a fear among healthcare organizations to employ Cloud Computing because of the privacy and security issues which can cause data leak from the Cloud to unauthorized users. Various researchers exerted tremendous effort to propose cloud framework to ensure data protection framework for the healthcare industry.
In (Chen & Hoang, 2011),
the researchers proposed a robust data protection framework that is surrounded
by a chain of protection schemes from Access Control, Monitoring, to Active
Auditing. The proposed framework includes
three major models for this chain of protection schemes. The first component of
this proposed robust framework includes Cloud-based, Privacy-aware, and
Role-based Access Control (CPRBAC) model.
The second model includes the Triggerable
Data File Structure (TDFS) model. The
third component includes the Active
Auditing Scheme (AAS). In (Regola & Chawla, 2013), the researchers presented a
prototype infrastructure in Amazon’s Virtual Private Cloud to allow researchers
and practitioners to utilize the data in a HIPAA-compliant environment. In (Yu, Kollipara, Penmetsa, & Elliadka, 2013),
the researchers provided an approach for a distributed storage system using a
combination of RDBMS and NoSQL databases to ensure optimal system performance
and scalability. These three research
studies are examples of the tremendous effort exerted by researchers in the
domain of healthcare to ensure security.
Healthcare Use Case
The Healthcare Information System supports clinical and medical activities related to patient care. The system is an integration of several components where each component serves a specific need of a medical system. These components include Radiology Information System (RIS), Picture Archiving and Communication System (PACS), Laboratory Information System (LIS), and Policy and Procedure Management System (PPMS) (Yu et al., 2013).
In (Yu et al., 2013),
the researchers focused on the RIS which is a software used to manage the
patients and their radiology data such as ultrasound scans, X-rays, CT-scans, audio, and video. The patient activities management include
examination scheduling, patient data processing and monitoring, and analysis of
the patient records statistics. The
radiology data management include the processing of file records, formatting
and storing radiology data with a digital
signature, and tracking the film records.
The RIS deals with very large of unstructured and structured data. The RIS is often used with the PACS and
requires very large storage space.
The researchers examined two NoSQL databases
for this project: MongoDB and Cassandra. They found that MongoDB is more apt for
Healthcare Information Systems. Table 1 summarizes the comparison between
MongoDB and Cassandra, adapted from (Yu et al., 2013).
Table 1. Comparison between MongoDB and Cassandra for Healthcare data (Yu et al., 2013).
The RIS Framework in this project included the System Architecture, Cloud Architecture. The System
Architecture was deployed in AWS using EC2 (Elastic Compute Cloud), which can
be accessed by request from a browser
using HTML or a mobile client
application. The application server was placed in the Public Cloud. The database was
placed in the Private Cloud. When
the system requires communication with the Database in the Private, the request
must go through various security measures and pass through the security of the
Private Cloud and the firewall to connect to the storage server. The request
talks to either SQL or NoSQL database based on the data management logic model.
The System Architecture is deployed in
the Cloud. The Cloud Architecture involved Public Cloud and Private
Cloud. The Private Cloud was used to
store all sensitive data. The storage server controls the SQL and NoSQL
databases along with the security and backup capabilities and functionalities. The NAS server was used as the storage
solution to deal with the large volume of the healthcare data (Yu et al., 2013).
Advantages and Disadvantages of healthcare data in the Cloud
The Cloud Computing offer various advantages to several industries, including healthcare industry. The major benefits of using the Cloud Computing technology for healthcare include Scalability, Data Storage, Data Sharing and Data Availability, Reliability and Efficiency, and Cost Reduction (Pullarao & Thirupathi Rao, 2013). The major challenge when using Cloud Computing in the healthcare industry is the security. However, as demonstrated in the above use case, the risks of leaking data from the Cloud to unauthorized users can be mitigated and eliminated by using the Private Cloud which has additional security measures. Public Cloud should never be used for storing sensitive data. In the above use case, the Public Cloud was used only for the application layer, with security measures such as access control and SSL to access the data from the browser.
References
Chen, L., & Hoang, D. B. (2011, 16-18
Nov. 2011). Towards Scalable,
Fine-Grained, Intrusion-Tolerant Data Protection Models for Healthcare Cloud.
Paper presented at the 2011IEEE 10th International Conference on Trust,
Security, and Privacy in Computing and Communications.
Pullarao, K.,
& Thirupathi Rao, K. (2013). A secure approach for storing and using health
data in a private cloud computing environment. International Journal of Advanced Research in Computer Science, 4(9).
Regola, N., &
Chawla, N. (2013). Storing and using health data in a virtual private cloud. Journal of medical Internet research, 15(3),
e63.
Yu, W.
D., Kollipara, M., Penmetsa, R., & Elliadka, S. (2013, 9-12 Oct. 2013). A distributed storage solution for cloud-based
e-Healthcare Information System. Paper presented at the 2013 IEEE 15th
International Conference on e-Health Networking, Applications, and Services
(Healthcom 2013).
The purpose of this discussion is to discuss and analyze the current state of data storage for big data. The discussion also discusses and analyzes the impact of the Big Data storage on the organizational process.
Big Data and Big Data Analytics Brief Overview
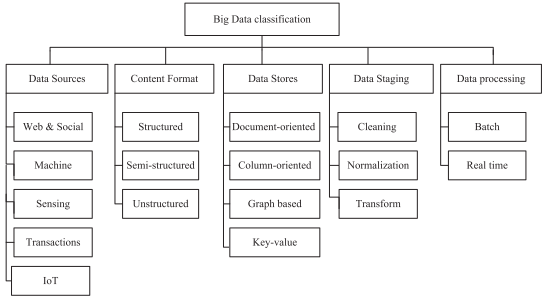
The term Big Data refers to the explosive growth in the volume of the data which are difficult to store, process and analyze. The volume of the Big Data is only one feature. However, the major 3Vs characterized Big Data with volume, variety, and velocity. The variety of the data is reflected by the different types of data collected from sensors, smartphones, or social networks. Thus, the data collected forms additional types of data such as unstructured, and semi-structured besides the structured type. The velocity characteristic of the Big Data reflects the speed of the data transfer, where the content of the data is continuously changing. These three major features characterize the Big Data nature. Big Data is classified even further to include Data Sources, Content Format, Data Stores, Data Staging, and Data Processing. Figure 1 summarizes the Big Data Classifications, adapted from (Hashem et al., 2015).
Figure 1. Big Data Classification. Adapted from (Hashem et al., 2015).
Big Data without Analytics has no value.
Big Data Analytics (BDA) is the process of examining large datasets
containing a variety of data types such as unstructured, semi-structured and
structured. The purpose of the BDA is to uncover hidden patterns, market
trends, unknown correlations, customer preferences and other useful business
information that can help the organization (Arora & Bahuguna, 2016). BDA has been
used in various industries such as healthcare.
Big Data Storage
The explosive growth of the data has challenged the capabilities of the existing storage technologies to store and manage data. Organizations have been utilizing the traditional storage techniques to store data through the structured relational database. However, the Big Data and BDA require distributed storage technology based on the Cloud Computing instead of the local storage attached to a computer or electronic device. Cloud Computing technologies provide a powerful framework which performs complex large-scale computing tasks and span a range of IT functions from storage and computation to database and application services. Organizations and users adopt the Cloud Computing technologies because of the need and requirements to store, process and analyze a large amount of data (Hashem et al., 2015).
Various storage technologies have been emerged to meet the requirements when
dealing with large volume of data. These storage technologies include Direct
Attached Storage (DAS), Network Attached
Storage (NAS), and Storage Area Network (SAN).
When using DAS, various hard disk drives are
directly connected to the servers. Each hard disk drive receives a
certain amount of I/O resource managed by the application. The DAS technology
is a good fit for servers that are
interconnected on a small scale. The
NAS technology provides a storage device which supports a network through a
switch or hub via TCP/IP protocols. When
using NAS, data is transferred as
files. The I/O in the NAS technology is
less burden than in DAS because the NAS server can indirectly access a storage
device through the networks. NAS
technology can orient the networks such as scalable and bandwidth-intensive
networks including the high-speed networks of optical-fiber connections. The SAN system of data storage is independent
with respect to storage on the local area
network. Data management and sharing are maximized by using the multipath data
switching which is conducted among
internal nodes. The organization data
storage system of DAS, NAS, SAN can be divided into three categories: disc array, connection and network
sub-systems, and storage management software. The disk array provides the
storage system. The connect and network
sub-systems provides connection to one or more disc arrays and servers. The storage management software monitors the data sharing, storage
management and disaster recovery tasks for multiple servers (Hashem et al., 2015).
When dealing with Big Data and BDA, the storage system is not physically separated from the processing
system. There are various storage types
such as hard drives, solid-state memory, object storage, optical storage and
cloud storage. Each type has advantages as well as limitations. Thus,
organizations must examine the goal and the objectives of the data storage first
prior selecting any of these storage media.
Table 1 shows a comparison of storage media, adapted from (Hashem et al., 2015).
Table 1. Comparison of Storage Media. Adapted from (Hashem et al., 2015).
The Hadoop Distributed File System (HDFS) is a primary component in Hadoop
technology, which is emerged to deal with Big Data and BDA. The other major
component of Hadoop technology is MapReduce.
The Hadoop framework is described to be the de facto standard for Big
Data storage and processing (Jinquan, Jie, Shengsheng, Yan, & Yuanhao, 2012). The HDFS is a distributed file system which
is designed to run on top of the local file systems of the cluster nodes. It
stores extremely large files for streaming purpose. HDFS is highly
faulted tolerant and can scale up from a single server to thousands of
nodes, where each offers local computation and storage.
The Cloud Computing technology can meet the requirement of the Big Data and
BDA offering effective framework and platform for computational purpose as well
as for storage purpose. Thus,
organizations which tend to take advantage of Big Data and BDA utilize the
Cloud Computing technology. However, the
use of the Cloud Computing does not come without a price. Security and privacy
have been major concerns to Cloud Computing users and organizations. Although Cloud Computing offers several
benefits to organizations from scalability, fault tolerance, to data storage,
yet, it is curbed by the security and privacy.
Organizations must take the appropriate security measures for data in storage,
transit, and processing, such as SSL,
Encryption, Access Control, Multi-Factor Authentication and so forth.
In summary, Big Data comes with Big Storage requirement. Organizations have been facing various
challenges when dealing with Big Data, such as data storage and data
processing. Data storage issue is partially solved by Cloud Computing technology. However, until the security and privacy
issues are resolved in the Cloud
Computing platform, organizations must apply robust security measures to
mitigate and alleviate the security risks.
References
Arora, M., &
Bahuguna, H. (2016). Big Data Security–The Big Challenge.
Hashem, I. A. T.,
Yaqoob, I., Anuar, N. B., Mokhtar, S., Gani, A., & Khan, S. U. (2015). The
rise of “big data” on cloud computing: Review and open research issues. Information Systems, 47, 98-115.
Jinquan,
D., Jie, H., Shengsheng, H., Yan, L., & Yuanhao, S. (2012). The Hadoop
Stack: New Paradigm for Big Data Storage and Processing. Intel Technology Journal, 16(4), 92-110.
The purpose of this discussion is to create the building blocks of a system for healthcare Big Data Analytics and compare the building block design to a DNA networked cluster currently used by an organization in the current market.
The discussion begins with the Cloud Computing
Building Blocks, followed by Big Data Analytics Building Blocks, and DNA
Sequencing. The discussion also addresses the building blocks for the health
analytics and the building blocks for DNA Sequencing System, and the comparison
between both systems.
Cloud Computing Building Blocks
The Cloud Computing model contains two elements: the front end and the back end. Both elements are connected to the network. The user interacts with the system using the front end, while the cloud itself is the back end. The front end is the client which the user uses to access the cloud through a device such as a smartphone, tablet, and laptops. The backend represented by the Cloud provides applications, computers, servers and data storage which creates the services (IBM, 2012).
As indicated in (Macias & Thomas, 2011),
three building blocks are required to enable Cloud Computing. The first block
is the “Infrastructure,” where the organization
can optimize data center consolidation, enhance network performance, connect
anyone, anywhere seamlessly, and implement pre-configured solutions. The second block is the “Applications,” where
the organization can identify
applications for rapid deployment, and utilize automation and orchestration
features. The third block is the
“Services,” where the organization can
determine the right implementation model, and create a phased cloud migration
plan.
In (Mousannif, Khalil, & Kotsis, 2013-14), the building
blocks for the Cloud Computing involve the physical layer, the virtualization
layer, and the service layer. Virtualization
is a basic building block in Cloud Computing.
Virtualization is the technology which hides the physical
characteristics of the computing platform from the front end users. Virtualization provides an abstract and
emulated computing platform. The
clusters and grids are features and characteristics in Cloud Computing for high-performance computing applications such as
simulations. Other building blocks of the Cloud Computing include
Service-Oriented Architectures (SOA) and Web Services (Mousannif et al., 2013-14).
Big Data Building Block
As indicated in (Verhaeghe, n.d.), there are four major building blocks for Big Data Analytics. The first building block is Big Data Management to enable organization capture, store and protect the data. The second building block for the Big Data is the Big Data Analytics to extract value from the data. Big Data Integration is the third building block to ensure the application of governance over the data. The last building block in Big Data is the Big Data Applications for the organization to apply the first three building blocks using the Big Data technologies.
DNA Sequencing
DNA stands for Deoxyribonucleic Acid which represents the smallest building block of life (Matthews, 2016). As indicated in (Salzberg, 1999), advances in biotechnology have produced enormous volumes of DNA-related information. However, the rate of data generation is outpacing the ability of the scientists to analyze the data. DNA Sequencing is a technique used to determine the order of the four chemical building blocks, called “bases,” which make up the DNA molecule (genome.gov, 2015). The sequence provides the kind of genetic information which is carried in a particular DNA segment. DNA sequencing can provide valuable information about the role of inheritance in susceptibility to disease and response to the influence of environment. Moreover, DNA sequencing provides rapid and cost-effective diagnosis and treatments. Markov chains and hidden Markov models are probabilistic techniques which can be used to analyze the result of the DNA sequencing (Han, Pei, & Kamber, 2011). Example of the DNA Sequencing application is discussed and analyzed in (Leung et al., 2011), where the researchers employed Data Mining on DNA Sequences biological data sets for Hepatitis B Virus.
DNA Sequencing was
performed on non-networked computers, using a limited subset of data due to the limited computer processing speed
(Matthews, 2016). However, DNA Sequencing has been
experiencing various advanced technologies and techniques. Predictive Analytic is an example of these
techniques which are applied to DNA
Sequencing resulting Predictive Genomics.
Cloud Computing plays a significant role in the success of the
Predictive Genomics for two major reasons.
The first reason is the volume of the genomic data, while the second
reason is the low cost (Matthews, 2016). Cloud Computing is becoming a valuable tool for various domains including the
DNA Sequencing. As cited in (Blaisdell, 2017), the study of the
Transparency Market Research showed that the healthcare Cloud Computing market
is going to evolve further, reaching up to $6.8 Billion by 2018.
Building Block for Healthcare System
Healthcare data requires protection due to the security and privacy concerns. Thus, Private Cloud will be used in this use case. To build a Private Cloud, the virtualization layer, the physical layer, and the service layer are required. The virtualization layer consists a hypervisor to allow multiple operating systems to share a single hardware system. The hypervisor is a program which controls the host processors and resources by allocating the resources to each operating system. Two types of hypervisors: native and also called bare-metal or type 1 and hosted also called type 2. Type 1 runs directly on the physical hardware while Type 2 runs on a host operating system which runs on the physical hardware. Examples of the native hypervisor include VMware’s ESXi, Microsoft’s Hyper-V. Example of the hosted hypervisor includes Oracle VirtualBox and VMware’s Workstation. The physical layer can consist of two computer pools one for PC and the other for the server (Mousannif et al., 2013-14).
In (Archenaa & Anita, 2015), the researchers
illustrated the secure Healthcare Analytic System. The Electronic health record is a
heterogeneous dataset which is given as input
to HDFS through Flume and Sqoop. The analysis of
the data is performed using MapReduce and Hive by implementing Machine Learning
algorithm to analyze the similar pattern
of data, and to predict the risk for patient health condition at an early stage. HBase database is
used for storing the multi-structured data. STORM is used to perform
live streaming and any emergency conditions such as patient temperature rate
falling beyond the expected level. Lambda function is also used in this healthcare system. The final component of a building block in Healthcare system involves
the reports generated by the top layer tools such as “Hunk.” Figure 1 illustrates the Healthcare System,
adapted from
Building Block for DNA and Next Generation Sequencing System
Besides the DNA Sequencing, there is a next-generation sequencing (NGS) which is increasing exponentially since 2007 (Bhuvaneshwar et al., 2015). In (Bhuvaneshwar et al., 2015), the Globus Genomic System is proposed as an enhanced Galaxy workflow system made available as a service offering users the capability to process and transfer data easily, reliably and quickly. This system addresses the end-to-end NGS analysis requirements and is implemented using Amazon Cloud Computing Infrastructure. Figure 2 illustrates the framework for the Globus Genomic System taking into account the security measures for protecting the data. Examples of healthcare organizations which are using Genomic Sequencing include Kaiser Permanente in Northern California, and Geisinger Health System in Pennsylvania (Khoury & Feero, 2017).
Figure 2. Globus Genomics System for Next Generation Sequencing (NGS). Adapted from (Bhuvaneshwar et al., 2015).
In summary, Cloud Computing has reshaped the
healthcare industry in many aspects. Healthcare
Cloud Computing and Analytics provide many benefits from the easy access to the
electronic patient records to DNA Sequencing and NGS. The building blocks of the Cloud Computing
must be implemented with care for security and privacy consideration to protect
the patients’ data from unauthorized users. The building blocks for Healthcare Analytics
system involves advanced technologies such as Hadoop, MapReduce, STORM, Flume
as illustrated in Figure 1. The building
blocks for DNA Sequencing and NGS System involves Dynamic Worker Pool,
HTCondor, Shared File System, Elastic Provisioner, Globus Transfer and Nexus,
and Galaxy as illustrated in Figure 2.
Each system has the required building blocks to perform the analytics
tasks.
References
Archenaa, J., & Anita, E. M. (2015). A
survey of big data analytics in healthcare and government. Procedia Computer Science, 50, 408-413.
Bhuvaneshwar, K.,
Sulakhe, D., Gauba, R., Rodriguez, A., Madduri, R., Dave, U., . . . Madhavan,
S. (2015). A case study for cloud-based high throughput analysis of NGS data
using the globus genomics system. Computational
and structural biotechnology journal, 13, 64-74.
Leung, K., Lee,
K., Wang, J., Ng, E. Y., Chan, H. L., Tsui, S. K., . . . Sung, J. J. (2011).
Data mining on dna sequences of hepatitis b virus. IEEE/ACM Transactions on Computational Biology and Bioinformatics
(TCBB), 8(2), 428-440.
Mousannif, H.,
Khalil, I., & Kotsis, G. (2013-14). Collaborative learning in the clouds. Information Systems Frontiers, 15(2),
159-165. doi:10.1007/s10796-012-9364-y
Salzberg, S. L.
(1999). Gene discovery in DNA sequences. IEEE
Intelligent Systems and their Applications, 14(6), 44-48.
The purpose of this
project is to articulate all the steps conducted to perform analysis of heart disease use case. The project contained two main phases: Phase
1: Sandbox Configuration, and Phase 2: Heart Disease
Use Case. The setup and the configurations
are not trivial and did require the integration of Hive with MapReduce and
Tez. It also required the integration of
R and RStudio with Hive to perform transactions to retrieve and aggregate data.
The analysis included Descriptive
Analysis for all patients and then
drilled down to focus on the gender: female and males. Moreover,
the analysis included the Decision Tree and the Fast-and-Frugal Trees (FFTrees).
The researcher of this paper in agreement with other researchers that
Big Data Analytics and Data Mining can play a significant role in healthcare in
various areas such as patient care, healthcare
records, fraud detection, and
prevention.
Keywords: Decision Tree, Diagnosis of Heart Disease.
The medical
records and the databases to store these records are increasing rapidly. This rapid increase is leading the
researchers and practitioners to employ Big Data technologies. The Data Mining technique plays a significant
role in finding patterns and in extracting knowledge to provide better patient care
and effective diagnostic capabilities. As
indicated in (Koh
& Tan, 2011), “In healthcare, data mining is
becoming increasingly popular, if not increasingly essential.” Healthcare can benefit from Data Mining
application in various areas such as the evaluation of treatment effectiveness,
customer and patient relationship management, healthcare management, fraud
detection, and prevention. Moreover,
other benefits include predictive medicine and analysis of DNC
micro-arrays.
Various
research studies employed various Data Mining techniques in the
healthcare. In (Alexander
& Wang, 2017), the main objective of the study was
to identify the usage of Big Data Analytics to predict and prevent heart
attacks. The results showed that Big Data
Analytics is useful in predicting and pr3eventing attacks. In (Dineshgar
& Singh, 2016), the purpose of the study was to
develop a prototype Intelligent Heart Disease Prediction System (IHDPC) using
Data Mining technique. In (Karthiga,
Mary, & Yogasini, 2017), the researchers
utilized the Data Mining techniques to predict heart disease using the Decision
Tree algorithm and Naïve Bayes. The
result showed that the prediction accuracy of 99%. Thus, Data Mining techniques
enable the healthcare industry to predict patterns. In (Kirmani
& Ansarullah, 2016), the researchers
also applied the Data Mining techniques with the aim to investigate the result
after applying different types of Decision Tree methods to obtain the better
performance in the heart disease. These
research studies are examples of the vast literature on the use of Big Data
Analytics and Data Mining in the healthcare industry.
In this project, the heart disease
dataset is utilized as the Use Case for
Data Mining application. The project used Hortonworks sandbox, with
Hive, MapReduce, and Tez. The project
also integrated R with Hive to perform statistical
analysis including Decision Tree method.
The project utilized techniques from
various research studies such as (Karthiga et al.,
2017; Kirmani & Ansarullah, 2016; Martignon, Katsikopoulos, & Woike,
2008; Pandey, Pandey, & Jaiswal, 2013; Phillips, Neth, Woike, &
Gaissmaier, 2017; Reddy, Raju, Kumar, Sujatha, & Prakash, 2016).
The project begins with Phase 1 of Sandbox
Configuration, followed by Phase 2 of the
Heart Disease Use Case. The Sandbox
configuration included the environment set up
from mapping the sandbox IP to the Ambari Console management and the Integration of R and RStudio with Hive. The Heart Disease Use Case involved fourteen
steps starting from understanding the dataset to the analysis of the
result. The project articulates the steps and the commands as
required for this project.
After
the installation, the environment must be configured to function using the following
steps fully.
1.1 IP Address
and HTTP Web Port
After the Sandbox is installed, the host must use an IP address depending on the Virtual Machine (VMware, VirtualBox), or container (Docker). After the installation is finished, the local IP address is assigned with the HTTP web access port of 8888 as shown below. Thus, the local access is using http://127.0.0.1:8888/
The IP address can be mapped to a hostname using the hosts file a shown below. After setting the hostname to replace the IP address, the sandbox can be accessed from the browser using http://hortonworks-sandbox.com:8888.
There are five major users with different roles in Hortonworks Sandbox. These roles with their passwords and roles are summarized in Table 1.
Table 1. Users, Roles, Service, and Passwords.
With respect to the Access, putty can be used to access the sandbox using SSH with Port 2222. The root will get the prompt to specify the new password.
The shell web client is also known as Shell-in-a-box to issue shell commands without installing additional software. It uses port 4200. The admin password can be reset using the Shell Web Client.
The Admin can manage Ambari using the web address with port 8080 using the address of http://hortonworks-sandbox.com:8080 with the admin user and password. The admin can operate the cluster, manage users and group, and deploy views. The cluster section is the primary UI for Hadoop Operators. The clusters allow admin to grant permission to Ambari users and groups.
Test the query using MapReduce as the execution engine. The following query ran using MapReduce.
Configure Tez As the Execution Engine
in Hive
The
user can also modify the value for hive.execution.engine from mr to tez as Hive
is enabled on Tez execution and take advantage of the DAG execution
representing the query instead of multiple stages of MapReduce program which
involved a log of synchronization, barriers, and I/O overheads.
Click on Hive Settings tab.
Click Add New and add the following Key: Value pairs.
This integration is implemented on Tez to also take
advantage of the Directed Acyclic Graph (DAG) execution. This technique is
improved in Tez, by writing intermediate dataset into memory instead of hard
disk.
The
analysis of the heart disease dataset
included descriptive analysis and
decision tree. The result of the descriptive analysis showed that the minimum
age among the patients who are exposed to
the heart disease is 29 years old, while the maximum age is 79, with median and
mean of 52 years old. The result also
showed that the minimum cholesterol level for these patients is 126, while the
maximum is 564, with a median of 236 and
mean of 244 indicating that the
cholesterol level also gets increased with the increased age.
The
descriptive analysis drilled down and focused on gender (female vs. male) to identify the impact of the age on
the cholesterol for the heart disease patients.
The result showed the same trend among the female heart disease
patients, with a minimum age of 34, and
maximum age of 76, with median and mean
of 54. The cholesterol level among
female heart disease patients begins with the minimum of 141 and maximum of
564, and median of 250 and mean of 257.
The maximum cholesterol level of
564 is an outlier with another outlier in the age of 76. With respect
to the heart of the male disease
patients, the result showed the same trend.
Among the male heart disease patients, the results showed that the minimum age is 29 years old, and maximum age of
70 years old, with a median of 52 and
mean of 51. The cholesterol level among these
male heart disease patients showed 126 minimum and 325 maximum level, median
and mean of 233. There is another outlier
among the male heart disease patients at
the age of 29. Due to these outliers in
the dataset among the female and heart disease patients, the comparison between
male and female patients will not be accurate.
However, Figure 5 and Figure 6 show similarities in the impact of the
age on the cholesterol level between both genders.
With regard to the decision tree, the
first decision tree shows the data is
partitioned among six nodes. The
first two nodes are for the Resting Blood Pressure (RBP) attribute (RestingBP).
The first node of this cluster shows 65 heart disease patients have RBP of 138 or less, while the second node
of this cluster shows 41 heart disease patients have
RBP of greater than 138. These two nodes
show the vessels is zero or less with a heart rate
of 165 or less. For the vessel that
exceeds the zero level, there is another node with 95 patients. The second set of the nodes are for the heart
rate of greater than 165. The three
nodes are under the vessels; less than or equal zero vessels, and greater than
zero vessels. Two nodes are under the first categories of
zero or less, with 22 heart disease patients with a heart rate of 172 or less. The last node shows the vessels is
greater than zero with 15 heart disease patients. The FFTree
results show that the high-risk heart disease patients with vessel
greater than zero, while the low-risk patients are of zero or less of
vessels.
The
purpose of this project was to articulate all the steps conducted to perform
analysis of heart disease use case. The project contained two main phases: Phase
1: Sandbox Configuration, and Phase 2: Heart Disease
Use Case. The setup and the configurations
are not trivial and did require the integration of Hive with MapReduce and
Tez. It also required the integration of
R and RStudio with Hive to perform transactions to retrieve and aggregate data.
The analysis included Descriptive
Analysis for all patients and then
drilled down to focus on the gender: female and males. Moreover,
the analysis included the Decision Tree and the FFTrees. The researcher of this paper in agreement
with other researchers that Big Data Analytics and Data Mining can play a significant
role in healthcare in various areas such as patient care, healthcare records, fraud detection, and prevention.
Alexander, C., &
Wang, L. (2017). Big data analytics in heart attack prediction. The Journal of Nursing Care, 6(393).
Dineshgar,
G. P., & Singh, L. (2016). A Review of Data Mining For Heart Disease
Prediction. International Journal of
Advanced Research in Electronics and Communication Engineering (IJARECE), 5(2).
Karthiga,
A. S., Mary, M. S., & Yogasini, M. (2017). Early Prediction of Heart
Disease Using Decision Tree Algorithm. International
Journal of Advanced Research in Basic Engineering Sciences and Technology
(IJARBEST), 3(3).
Kirmani,
M. M., & Ansarullah, S. I. (2016). Prediction of Heart Disease using
Decision Tree a Data Mining Technique. IJCSN
International Journal of Computer Science and Network, 5(6), 885-892.
Koh,
H. C., & Tan, G. (2011). Data mining applications in healthcare. Journal of healthcare information
management, 19(2), 65.
Martignon,
L., Katsikopoulos, K. V., & Woike, J. K. (2008). Categorization with
limited resources: A family of simple heuristics. Journal of Mathematical Psychology, 52(6), 352-361.
Pandey,
A. K., Pandey, P., & Jaiswal, K. (2013). A heart disease prediction model
using decision tree. IUP Journal of
Computer Sciences, 7(3), 43.
Phillips,
N. D., Neth, H., Woike, J. K., & Gaissmaier, W. (2017). FFTrees: A toolbox
to create, visualize, and evaluate fast-and-frugal decision trees. Judgment and Decision Making, 12(4),
344.
Reddy, R. V. K., Raju, K. P., Kumar, M. J., Sujatha,
C., & Prakash, P. R. (2016). Prediction of heart disease using decision
tree approach. International Journal of
Advanced Research in Computer Science and Engineering, 6(3).
The purpose of this discussion is to discuss and analyze Big Data Analytics framework and relevant tools used in healthcare data analytics. The discussion also provides examples of how healthcare organizations can implement such a framework.
Healthcare can benefit from Big Data Analytics in
various domains such as decreasing the overhead costs, curing and diagnosing
diseases, increasing the profit, predicting epidemics and heading the quality
of human life (Dezyre, 2016). Healthcare organizations have been generating
the very large volume of data mostly
generated by various regulatory requirements, record keeping, compliance and
patient care. There is a projection from
McKinsey that Big Data Analytics in Healthcare can decrease the costs
associated with data management by $300-$500 billion. Healthcare data includes electronic health
records (EHR), clinical reports, prescriptions, diagnostic reports, medical
images, pharmacy, insurance information such as claim and billing, social media
data, and medical journals (Eswari, Sampath, & Lavanya, 2015; Ward, Marsolo,
& Froehle, 2014).
Various healthcare organizations such as scientific
research labs, hospitals, and other
medical organizations are leveraging Big Data Analytics to reduce the costs
associated with healthcare by modifying the treatment delivery models. Some of the Big Data Analytics technologies
have been applied in the healthcare industry. For instance, Hadoop technology has been used in healthcare analytics in various
domains. Examples of Hadoop application
in healthcare include cancer treatments and genomics, monitoring patient
vitals, hospital network, healthcare intelligence, fraud prevention and
detection (Dezyre, 2016). Thus, this discussion is limited to the
Hadoop technology in healthcare. The
discussion begins with the types of analytics and the potential benefits of
some of the analytic in healthcare, and then followed by the main discussion
about Hadoop Framework for Diabetes including its major components of the
Hadoop Distributed File System (HDFS) and Map/Reduce.
Types of Analytics
There are four major analytics types: Descriptive Analytics, Predictive Analytics, Prescriptive Analytics (Apurva, Ranakoti, Yadav, Tomer, & Roy, 2017; Davenport & Dyché, 2013; Mohammed, Far, & Naugler, 2014), and Diagnostic Analysis (Apurva et al., 2017). The Descriptive Analytics are used to summarize historical data to provide useful information. The Predictive Analytics is used to predict future events based on the previous behavior using the data mining techniques and modeling. The Prescriptive Analytics provides support to use various scenarios of data models such as multi-variables simulation, detecting a hidden relationship between different variables. It is useful to find an optimum solution and the best course of action using the algorithm. The Prescriptive Analytics, as indicated in (Mohammed et al., 2014) is less used in the clinical field. The Diagnostic Analytics is described as an advanced type of analytics to get to the cause of a problem using drill-down techniques and data discovery.
Hadoop Framework for Diabetes
The predictive analysis algorithm is utilized by (Eswari et al., 2015) in Hadoop/MapReduce environment in predicting the diabetes types prevalent, the complications associated with each diabetic type, and the required treatment type. The analysis used by (Eswari et al., 2015) was performed on Indian patients. In accordance to the World Health Organization, as cited in (Eswari et al., 2015), the probability for the age between 30-70 for patients to die from four major Non-Communicable Diseases (NCD) such as diabetes, cancer, stroke, and respiratory is 26%. In 2014, 60% of all death in India was caused by NCDs. Moreover, in accordance with the Global Status Report, as cited in (Eswari et al., 2015), NCD claims will reach 52 million patients globally by the year of 2030.
The architecture for the predictive analysis included
four phases: Data Collection, Data
Warehousing, Predictive Analysis, Processing Analyzed Reports. Figure 1 illustrates the framework used for
the Predictive Analysis System-Healthcare application, adapted from (Eswari et al., 2015).
Figure 1. Predictive Analysis Framework for Healthcare. Adapted from (Eswari et al., 2015).
Phase
1: The Data Collection phase included raw
diabetic data which is loaded into the system.
The data is unstructured including EHR, patient health records (PHR),
clinical systems and external sources such as government, labs, pharmacies,
insurance and so forth. The data have different formats such as .csv, tables,
text. The data which was collected from various sources in the first
phase was stored in Data Warehouses.
Phase
2: During the second
phase of data warehousing, the data gets cleansed,
and loaded to be ready for further processing.
Phase
3: The third phase involved the Predictive
Analysis which used the predictive algorithm in Hadoop, Map/Reduce environment
to predict and classify the type of DM, complications associated with each type, and the treatment type to be provided.
Hadoop framework was used in this analysis because it can process
extremely large amounts of health data by allocating partitioned data sets to
numerous servers. Hadoop utilized the
Map/Reduce technology to solve different parts of the larger problem and integrate them into
the final result. Moreover, Hadoop utilized the Hadoop
Distributed File System (HDFS) for the distributed system. The Predictive
Analysis phase involved Pattern Discovery
and Predictive Pattern Matching.
With respect to
the Pattern Discovery, it was important for DM to test patterns such as plasma,
glucose concentration, serum insulin, diastolic blood pressure, diabetes
pedigree, Body Mass Index (BM), age, number of times pregnant. The
process of the Pattern Discovery included the association rule mining between
the diabetic type and other information such as lab results. It also included
clustering to cluster and group similar patterns. The classification step of the Pattern Discovery
included the classification of patients risk based on the health
condition. Statistics were used to analyze the Pattern Discovery. The last step in the Pattern Discovery
involved the application. The process of
the Pattern Discovery of the Predictive Analysis phase is illustrated in Figure 2
Figure 2. Pattern Discovery of the Predictive Analysis.
With respect to
Predictive Pattern Matching of the Predictive Analysis, the Map/Reduce
operation was performed whenever the
warehoused dataset was sent to Hadoop
system. The Pattern Matching is the
process of comparing the analyzed threshold value with the obtained value. The Mapping phase involved splitting the
large data into small tasks for Worker/Slave Nodes (WN). As illustrated in Figure 3, the Master Node (MN)
consists of Name Node (NN) and Job Tracker (JT) which used the Map/Reduce
technique. The MN sends the order to Worker/Slave Node,
which process the pattern matching task for diabetes data with the help of Data
Node (DN) and Task Tracker (TT) which reside on the same machine of the WN. If the WN completed the pattern matching
based on the requirement, the result was stored
in the intermediate disk, known as local write. If the MN initiated the reduce task, all
other allocated Worker Nodes read the processed data from the intermediate
disks. The reduce task is performed in the WN based on the query
received from the Client to the MN. The
results of the reduce phase will be distributed
in various servers in the cluster.
Figure 3. Pattern Matching System Using Map/Reduce. Adapted from (Eswari et al., 2015).
Phase
4: In this phase, the Analyzed Reports are processed and
distributed to various servers in the cluster and replicated through several
nodes depending on the geographical area.
Using the proper electronic communication technology to exchange the
information of patients among healthcare centers can lead to obtaining proper treatment at the right time in
remote locations at low cost.
The implementation of Hadoop framework did help in
transforming various health records of diabetic patients to useful analyzed
result to help patients understand the complication depending on the type of diabetes.
References
Apurva, A., Ranakoti, P., Yadav, S.,
Tomer, S., & Roy, N. R. (2017, 12-14 Oct. 2017). Redefining cyber security with big data analytics. Paper presented
at the 2017 International Conference on Computing and Communication
Technologies for Smart Nation (IC3TSN).
Davenport, T. H.,
& Dyché, J. (2013). Big data in big companies. International Institute for Analytics.
Eswari, T.,
Sampath, P., & Lavanya, S. (2015). Predictive methodology for diabetic data
analysis in big data. Procedia Computer
Science, 50, 203-208.
Mohammed, E. A.,
Far, B. H., & Naugler, C. (2014). Applications of the MapReduce Programming
Framework to Clinical Big Data Analysis: Current Landscape and Future Trends. BioData mining, 7(1), 1.
Ward,
M. J., Marsolo, K. A., & Froehle, C. M. (2014). Applications of business
analytics in healthcare. Business Horizons,
57(5), 571-582.
The purpose of this discussion is to discuss and analyze a NoSQL database type such as Cassandra, MongoDB and how it is used or applied to health informatics data analytics. The discussion is based on a project implemented by (Klein et al., 2015). In this project, the researchers performed application-specific prototyping and measurement to identify NoSQL products which can fit a data model and can query use cases to meet the performance requirements of the provider. The provider was a healthcare provider with specific requirements to employ Electronic Health Record (EHR) system. The project used three NoSQL databases Cassandra, MongoDB, and Riak as the three candidates based on the maturity of the product and the availability of the enterprise support. The researchers faced challenges of selecting the right NoSQL during their work on the project.
This research study
is selected because it is comprehensive and it has rich information about the
implementation of these three data stores in healthcare. Moreover, the research
study has additional useful information regarding healthcare such HL7, and healthcare-specific
data models of “FHIR Patient Resources” and “FHIR Observation Resources,”
besides the performance
framework such as YCSB.
NoSQL Database Application in Healthcare
The provider has been using thick client system running at each site around the globe and connected to a centralized relational database. The provider has no experience with NoSQL. The purpose of the project was to evaluate NoSQL databases which will meet their needs.
The provider was a large healthcare
provider requesting a new EHR system which supports healthcare delivery for
over nine million patients in more than 100 facilities across the world. The rate of the data growth is more than one
terabyte per month. The data must be retained
for ninety-nine years. The technology of
NoSQL was considered for two major
reasons. The first reason involved a Primary
Data Store for the EHR system. The
second reason is to improve request latency and availability by using a local
cache at each site.
The project involved four major
steps as discussed below. Step four
involved five major configuration tasks to test the identified data stores as
discussed below as well. This EHR system
requires robust and strong replica consistency.
A comparison was performed between
the identified data stores for the strong replica consistency vs. the eventual
consistency.
Project Implementation
Step 1: Identity the Requirement: The
first step in this project was identify the requirements from the stakeholders
of the provider. These requirements are used to develop the evaluation of NoSQL
database. There were two main
requirements. The first requirement
involved high availability with low latency with a high load in distributed systems.
This first requirement reflected the performance and the scalability as
the measure to evaluate the NoSQL candidates.
The second requirement involved logical data models and query patterns
supported by NoSQL, and replica consistency in a distributed framework. This requirement reflected the data model
mapping as the measure to evaluate the NoSQL candidates.
Step 2: Define Two
Primary Use Cases for the Use of the EHR System: The
providers provided two specific use cases for the EHR system. The first use case was to read recent medical
test results for a patient. This use case is regarded to be the core function
used to populate the user interface when a clinician selects a new
patient. The
second use case was to achieve a strong replica consistency when a new medical
test result is written for a patient. The purpose of this strong replica
consistency is to allow all clinicians using the EHR framework to see the
information to make health care decision for the patient, with no regard to the
location of the patient either at the same site or in another location.
Step 3: Select the
Candidate NoSQL Database: The provider requested the evaluation of different data
models of NoSQL data stores such as key-value, column, and document to
determine the best-fit NoSQL which can
meet their requirements. Thus,
Cassandra, MongoDB, and Riak were the
candidates for this project based on the maturity of the product and enterprise
support.
Step 4: Performance Tests Design and Execution: A systematic test process was designed and executed to evaluate the three candidates based on the use cases requirements defined earlier. This systematic test process included five major Tasks as summarized in Table 1.
Table 1: Summary of the Performance Tests Design and Execution Tasks.
Task 1: Test Environment Configuration: The test environment was developed using the three identified NoSQL databases: MongoDB, Cassandra, and Riak. Table 2 shows the identified NoSQL database, types, version, and source. The test environment included two configurations. The first configuration involved a single node server. The purpose of the first single-node environment was to validate the test environment for each database type. The second configuration involved nine-node environment. The purpose of the nine-node environment was to represent the production environment that was geographically distributed across three data centers. The dataset was shared across three nodes, and then replicated to two additional groups; each group has three nodes. The replication configuration is implemented based on each NoSQL database. For instance, when using MongoDB, the replica systems are implemented using the Primary/Secondary feature. When using Cassandra, the replica configuration is implemented using the data center built-in awareness distribution feature. When using Riak, the data was shared across all nine nodes, with three replicas of each shared stored across the nine nodes. Amazon EC2 (Elastic Compute Cloud) instances were used for the test environment implementation. Table 3 describes the EC2 type and source.
Table 2: Summary of Identified NoSQL Databases, Types, Versions, Sources, and Implementation.
Table 3: Details of Nodes, Types, and Size.
Task 2: Data Model Mapping: A logical data model was mapped to the identified data model for the healthcare. The identified data model was HL7 Fast Healthcare Interoperability Resources (FHIR). HL7 is Health Level-7 refers to a set of identified international standards to transfer clinical and administrative data between software applications. Various healthcare providers use these applications. These identified international standards focus on the application layer, which is layer-7 in the OSI model (Beeler, 2010). Two models were used: “FHIR Patient Resources,” and “FHIR Observation Resources.” The test results for a patient were modeled using the “FHIR Patient Resources” such as names, address, and phone, while other medical related information such as test type, result quantity, and result units were modeled using “FHIR Observation Resources.” The relationship between patient and test results was a one-to-many relationship (1: M), and between patient and observations was also one-to-many relationship as illustrated in Figure 1.
Figure 1: The Logical Data Model and the Relationship between Patient, Test Result, and Observations.
This relationship of 1:
M between the patient and the test result and the observation, and the
need to access efficiently the most recently written test results were very challenging for each identified NoSQL
data store. Thus, for MongoDB, the researchers used a composite index
of two attributes (Patient ID, Observation ID) for the test result records, and
indexed by the lab result data-time stamp.
Using this approach enabled the efficient retrieval process of the most
recent test result records for a particular patient. For Cassandra, the researchers used a similar
approach as MongoDB but using a composite
index of three attributes (Patient ID, Lab Result, Data-Time Stamp). The retrieval of the most recent test result
was efficient using this approach of the three-composite
index in Cassandra because the result was returned
sorted by the server. With respect to
Riak, the relationship of 1: M was more
complicated than MongoDB and Cassandra.
The key-value data model of Riak enables the retrieval of a value, which
has a unique key. Riak has the feature
of a “secondary index” to avoid a full scan when the key is not known. However, each node in the cluster stores the
secondary indices for those shards stored by the nodes. The secondary index requires a query to match
such an index, which results in “scatter-gather” performed by the “request
coordinator” asking each node for records with the requested secondary index
value, waiting for all nodes to respond, and then sending the list of keys for
the matching records back to the requester.
This operation causes latency to locate records and the need for two
round trips to retrieve the records had a negative impact on the performance of
Riak data store. There is no technique
in Riak to filter and return only the most recent observations for a patient. Thus, all matching records must be returned
and then sorted and filtered by the client.
Table 4 summarizes the data model mapping for each of the identified
data store, and the impact on performance.
Table 4: Data Model Mapping and Impact on Performance.
Task
3: Data Generation and Load: The dataset contained one
million patient records (Patient Records: N=1,000,000), and ten million records
for test results (Test Results Records: N=10,000,000). The number for the test
result for a patient ranged from zero to twenty with an average of seven (Test
Result for each Patient: Min=0, Max=20,
Mean=7).
Task 4: Load Test Client: For this task, the researchers used Yahoo Cloud Serving Benchmark (YCSB) framework to manage the execution of the test, and to test the measurement. One of the key features of YCSB, as indicated in (Cooper, Silberstein, Tam, Ramakrishnan, & Sears, 2010), is the extensibility, which provides an easy definition of new workload types, and flexibility to benchmark new systems. YCSB framework and workloads are available in open source for system evaluations. The researchers replaced the simple data models, data sets, and queries of YCSB framework to reflect the project implementations are meeting the specific use cases of the providers. Another YCSB feature are the ability to specify the total number of operations and the mix of reading and write operations in a workload. The researchers utilized this feature and applied the 80% read, and %20 write for each load for EHR system in response to the provider’s requirements. Thus, the read operations were used to retrieve the five most recent observations for a patient, and the write operations were used to insert a new observation record for a patient. Two use cases for workload were used. The first use case was to test the data store as a local cache, which involved the write-only workload operation which was performed on a daily basis to load a local cache from a centralized primary data store with records for patients with a scheduled appointment that day. The second use case was for the read workload to flush the cache back to the centralized primary data store as illustrated in Figure 2.
Figure 2. Read (R) and Write Workloads.
The “operation latency” was measured by the YCSB
framework, as the time calculated between the request time and the response
time from the data store. The calculation for reading and write operation latency was
performed separately using the YCSB framework. Besides the “operation latency,” the latency
distribution is a key scalability metric in Big Data Analytics. Thus, the
researchers recorded both the average and the 95% values. Moreover, the researchers extended the test
to include the overall throughput in operations per second, which reflected the
total number of operations for reading
and write divided by the total workload execution time, excluding the time for
the initial setup and the cleaning to obtain a more
accurate result.
Task
5: Test Script Development and Execution:
In this task, the researchers performed three runs to
decrease any impact associated with the transient events in the cloud
infrastructure. These three runs were performed for each of the identified data stores.
The standard deviation of the throughput for any three-run set never
exceeded 2% of the average. YCSB allows running multiple execution threads
to create concurrent client sessions. Thus, the workload execution was repeated for a defined range of test client
threads for each of the three-run tests. This workload execution approach
created a corresponding number of concurrent database connections. The researchers indicated that NoSQL data
stores are not designed to operate with a large number of concurrent database
client sessions. NoSQL databases can usually
handle between 16-64 concurrent sessions.
The researchers analyzed the appropriate approach to distributing the multiple concurrent connections to the database across the server nodes. Based on their analysis, the researchers found that MongoDB utilizes a centralized router node and all clients connected to that single router node. With respect to Cassandra, the data center built-in awareness distribution feature created three sub-clusters of three nodes each, and client connections were spread uniformly across the three nodes in one sub-clusters. With respect to the Riak data store, client connections are allowed only to be spread uniformly across the full set of the nine-node. Table 5 summarizes how each data stores handles concurrent connections in a distributed system.
Table 5. A Summary of the Data Store Techniques for Concurrent Connections in Distributed System.
Results and Findings
The nine-node topology was configured to represent the production system. Moreover, a single server configuration was also tested which demonstrated its limitation for production use. Thus, the performance result does not reflect the single server configuration but rather the nine-node topology configuration and test execution. However, the comparison between the single node and distributed nine-node scenario was performed to provide insight on the performance of the data store and the efficiency of the distributed systems and the tradeoff to scale up with more nodes versus using faster nodes with more storage. The results covered three major areas: Strong Consistency Evaluation, Eventual Consistency Evaluation, and Performance Evaluation.
Strong Consistency Evaluation
With respect to MongoDB, all writes were committed on the Primary Server, while all reads were performed from the Primary Server. In Cassandra, all writes were committed on a quorum formed on each of the three sub-clusters, while the read operations required a quorum only on the local sub-cluster. With respect to Riak, the effect was to require a quorum on the entire nine-node cluster for both read and write operations. Table 6 summarizes this strong consistency evaluation result.
Table 6. Strong Consistency Evaluation. Adapted from (Klein et al., 2015).
Eventual
Consistency Evaluation: The eventual consistency tests were performed on Cassandra and Riak. The results showed that writes were committed
on one node with replication occurring after the operation was acknowledged to the client. The results also showed that read operations were executed on one replica, which may or may
not return the latest values written to the data store.
Performance Evaluation: Cassandra demonstrated the best overall performance result among MongoDB and Riak peaking at approximately 3500 operations per seconds as illustrated in Figure 3. The comparison in Figure 3 include throughput read-only workload, write-only workload and read/write workload, replicated data, and quorum consistency for these three data stores.
Figure 3. Workload Comparison among Cassandra, MongoDB, and Riak.
Adapted from (Klein et al., 2015).
The decreased contention of storage I/O improved the
performance, while additional work of coordinating write and read quorums
across replicas and data centers decreased the performance. With respect
to Cassandra, the improved performance exceeded the degraded performance
resulting in net higher performance in the distributed configuration than the
other two data stores. The built-in
awareness distributed feature in Cassandra participated in the improved
performance of Cassandra because this feature separates replication and
sharding configurations. This
separation allowed larger read operations
to be completed without the requirement
of request coordination such as P2P proxying of the client request as the case
in Riak.
With respect to
latency, the results showed for the read/write workload that MongoDB had a
constant average latency as the number of concurrent sessions with the
increased number of concurrent sessions.
The result also showed the read/write operations, that Cassandra
achieved the highest overall throughput, it had the highest latencies
indicating high internal concurrency in processing the requests.
Conclusion
Cassandra data store demonstrated the best throughput performance, but with the highest latency for the specific workloads and configurations tested. The researchers analyzed such results of Cassandra that Cassandra provides hash-based sharding spread the request and storage load better than MongoDB. The second reason is that indexing feature of Cassandra allowed efficient retrieval of the most recently written records, compared to Riak. The third reason is that the P2P architecture and data center aware feature of Cassandra provide efficient coordination of both reads and write operations across the replicas nodes and the data centers.
The results
also showed that MongoDB and Cassandra provided a more efficient result with respect to the performance than Riak data store. Moreover, they provided strong replica
consistency required for such application of the data models. The researchers concluded that MongoDB
exhibited more transparent data modeling
mapping than Cassandra, besides the indexing capabilities of MongoDB, were found to be a better fit for such
application.
Moreover, the results also showed that the throughput
varied by a factor of ten, read operation latency varied by a factor of five,
and write latency by a factor of four with the highest throughput product
delivering the highest latency. The results also showed that the throughput for
workloads using strong consistency was 10-25% lower than workloads using
eventual consistency.
Cooper, B. F.,
Silberstein, A., Tam, E., Ramakrishnan, R., & Sears, R. (2010). Benchmarking cloud serving systems with
YCSB. Paper presented at the Proceedings of the 1st ACM symposium on Cloud
computing.
Klein,
J., Gorton, I., Ernst, N., Donohoe, P., Pham, K., & Matser, C. (2015, June
27 2015-July 2 2015). Application-Specific
Evaluation of No SQL Databases. Paper presented at the 2015 IEEE
International Congress on Big Data.