"Artificial Intelligence without Big Data Analytics is lame, and Big Data Analytics without Artificial Intelligence is blind." Dr. O. Aly, Computer Science.
The purpose of this discussion is to continue working with R using state.x77 dataset for this assignment. In this task, the dataset will get converted to a data frame. Moreover, regression will be performed on the dataset. The commands used in this discussion are derived from (r-project.org, 2018). There are four major tasks. The discussion begins with Task-1 to understand and examine the dataset. Task-2 covers the data frame creation. Task-3 is to examine the data frame. Task-4 investigates the data frame using the Linear Regression analysis. Task-4 is comprehensive as it covers the R commands, the results of the commands and the analysis of the result.
Task-1: Understand and Examine the dataset:
The purpose of this task is to understand and examine the dataset.
The following is a summary of the
variables from the information provided in the help site as a result of ?state.x77
command:
Command: > ?state.x77
Command: > summary(state.x77)
Command: >head(state.x77)
Command: >dim(state.x77)
Command:
>list(state.x77)
The
dataset of state.x77has 50 rows and 8 columns giving the following statistics
in the respective columns.
##The first 10 lines of Income, Illiteracy, and
Murder.
state.x77.df$Income[1:10]
state.x77.df$Illiteracy[1:10]
state.x77.df$Murder[1:10]
The descriptive statistical analysis (Central
Tendency) (mean, median, min, max, 3th quantile) of the Income, Illiteracy, and
Population variables.
Task-4:
Linear Regression Model – Commands, Results and Analysis:
plot(Income~Illiteracy, data=state.x77.df)
mean.Income=mean(state.x77.df$Income, na.rm=T)
abline(h=mean.Income, col=”red”)
model1=lm(Income~Illiteracy, data=state.x77.df)
model1
Figure 1. Linear Regression Model for Income and Illiteracy.
Analysis: Figure 1 illustrates the Linear Regression between Income and Illiteracy. The result of the Linear Regression of the Income as a function of the Illiteracy shows that the income increases when the illiteracy percent decreases, and vice versa, indicating there is a reverse relationship between the illiteracy and income. More analysis on the residuals and the fitted lines are discussed below using plot() function in R.
Command: > plot(model1)
Figure 2. Residuals vs. Fitted in Linear Regression Model for Income and Illiteracy.
Analysis: Figure 2 illustrated the Residuals vs. Fitted in the
Linear Regression Model for Income as a function of the Illiteracy. The residuals
depict the difference between the actual value of the response variable and the
response variable predicted using the regression equation (Hodeghatta & Nayak, 2016). The principle
behind the regression line and the regression equation is to reduce the error
or this difference (Hodeghatta & Nayak, 2016).
The expectation is that the median value should be very near to zero (Hodeghatta & Nayak, 2016). For the model to
pass the test of linearity, no pattern in the distribution of the residuals
should exist (Hodeghatta & Nayak, 2016). When there is no pattern in the distribution
of the residuals, it passes the condition of linearity (Hodeghatta & Nayak, 2016). The Plot of the fitted values against the
residuals with a line shows the
relationship between the two. The
horizontal and straight line indicates that the “average residual” for all
“fitted values” is more or less the same (Navarro, 2015). The result of the Linear Regression for the
identified variables of Illiteracy and Income (Figure 2) shows that the
residual has a curved pattern, indicating that a better model can be obtained using the quadratic term because ideally, this line should be a straight
horizontal line.
Figure 3. Normal Q-Q Plot of the Linear Regression Model for Illiteracy and Income.
Analysis:
Figure
3 illustrates the Normal Q-Q plot, which is used to test the normality of the
distribution (Hodeghatta & Nayak, 2016). The result shows that the residuals are
almost on the straight line in the preceding
Normal Q-Q plot, indicating that the residuals are
normally distributed. Hence, the
normality test of the residuals is passed.
Figure 4. Scale-Location Plot Generated in R to Validate Homoscedasticity for Illiteracy and Income.
Analysis:
Figure
4 illustrates the Scale-Location graph, which is one of the graphs generated as
part of the plot command above. The
points are spread in a random fashion around the near horizontal line, as such ensures that the assumption of
constant variance of the errors (or homoscedasticity) is fulfilled (Hodeghatta & Nayak, 2016).
Figure 5. Residuals vs. Leverage Plot Generated in R for the LR Model.
Analysis:
Figure
5 illustrates the Residuals vs. Leverage Plot generated for the LR Model. In this plot of Residuals vs. Leverage, the
patterns are not relevant as the case
with the diagnostics plot of the linear regression. In this plot, the outlying values at the
upper right corner or the lower right corner are watched (Bommae, 2015). Those spots are the places where a case can be influential against a regression
line (Bommae, 2015). When cases are outside of the Cook’s
distance, meaning they have high Cook’s distance scores, the cases are
influential to the regression results (Bommae, 2015).
##Better understand the linearity of the relationship
represented by the model.
Command:
>crPlots(model1)
Figure 6. crPlots() Plots for the Linearity of the Relationship between Income and Illiteracy of the Model.
Analysis: Figure 6 illustrates the crPlots() function, which is used to understand better the linearity of the relationship represented by the model (Hodeghatta & Nayak, 2016). The non-linearity requires to re-explore the model (Hodeghatta & Nayak, 2016). The result of Figure 6 shows that the model created is linear and the reverse relationship between income and the illiteracy as analyzed above in Figure 1.
##Examine the Correlation between Income and
Illiteracy.
Analysis:
The
correlation result shows a negative association between income and illiteracy
as anticipated in the linear regression model.
The purpose of this discussion is to compare the assumptions of General Least Square Model (GLM) modeling for regression and correlations. This discussion also covers the issues with transforming variables to make them linear. The procedure in R for linear regression is also addressed in this assignment. The discussion begins with some basics such as measurement scale, correlation, and regression, followed by the main topics for this discussion.
Measurement Scale
There are three types of measurement scale. There is nominal (categorical) such as race, color, job, sex or gender, job status and so forth (Kometa, 2016). There is ordinal (categorical) such as the effect of a drug could be none, mild and severe, job importance (1-5, where 1 is not important and 5 very important and so forth) (Kometa, 2016). There is the interval (continuous, covariates, scale metric) such as temperature (in Celsius), weight (in kg), heights (in inches or cm) and so forth (Kometa, 2016). The interval variables have all the properties of nominal and ordinal variables (Bernard, 2011). They are an exhaustive and mutually exclusive list of attributes, and the attributes have a rank-order structure (Bernard, 2011). They have one additional property which is related to the distance between attributes (Bernard, 2011). The distance between the attributes are meaningful (Bernard, 2011). Therefore, the interval variables involve true quantitative measurement (Bernard, 2011).
Correlations
Correlation analysis is used to measure the association between two variables. A correlation coefficient ( r ) is a statistic used for measuring the strength of a supposed linear association between two variables (Kometa, 2016). The correlation analysis can be conducted using interval data, ordinal data, or categorical data (crosstabs) (Kometa, 2016). The fundamental concept of the correlation requires the analysis of two variables simultaneously to find whether there is a relationship between the two sets of scores, and how strong or weak that relationship is, presuming that a relationship does, in fact, exist (Huck, Cormier, & Bounds, 2012). There are three possible scenarios within any bivariate data set. The first scenario is referred to as high-high, low-low when the high and low score on the first variable tend to be paired with the high and low score of the second variable respectively. The second scenario is referred to as high-low, low-high, when the relationship represents inverse, meaning when the high and low score of the first variable tend to be paired with a low and high score of the second variable. The third scenario is referred to as “little systematic tendency,” when some of the high and low scores on the first variable are paired with high scores on the second variable, whereas other high and low scores on the first variable are paired with low scores of the second variable (Huck et al., 2012).
The correlation coefficient varies from -1 and +1 (Huck et al., 2012; Kometa, 2016). Any ( r ) falls on the right side represents
a positive correlation, indicating a direct
relationship between the two measured variables, which can be categorized under the high-high, low-low
scenario. However, any ( r ) falls on
the left side represents a negative correlation, indicating indirect, or
inverse, relationship, which can be categorized
under high-low, low-high scenario. If (
r ) lands on either end of the correlation continuum, the term “perfect” may be
used to describe the obtained correlation. The term high comes into play when (
r ) assumes a value close to either end,
thus, implying a “strong relationship,” conversely, the term low is used when (
r ) lands close to the middle of the continuum, thus, implying a “weak
relationship.” Any ( r ) ends up in the middle area of the
left, or right side of the correlation
continuum is called “moderate” (Huck et al., 2012). Figure 1 illustrates the correlation continuum
of values -1 and +1.
Figure 1. Correlation Continuum (-1 and +1) (Huck et al., 2012).
The most common correlation coefficient is the Pearson
correlation coefficient, used to measure the relationship between two interval
variables (Huck et al., 2012; Kometa, 2016). Pearson correlation is designed for situations where each of the two variables is
quantitative, and each variable is measured to
produce raw scores (Huck et al., 2012). Spearman’s Rho is the second most popular
bivariate correlational technique, where each of the two variables is measured
to produce ranks with resulting correlation coefficient symbolized as rs or p (Huck et al., 2012). Kendall’s Tau is similar to Spearman’s Rho (Huck et al., 2012).
Regression
When dealing with correlation and association between statistical variables, the variables are treated in a symmetric way. However, when dealing with the variables in a non-symmetric way, a predictive model for one or more response variables can be derived from one or more of the others (Giudici, 2005). Linear Regression is a predictive data mining method (Giudici, 2005; Perugachi-Diaz & Knapik, 2017).
Linear Regression is described to be the most important prediction method for continuous
variables, while Logistic Regression is the main prediction method for
qualitative variables (Giudici, 2005). Cluster analysis is different from Logistic
Regression and Tree Models, as in the cluster analysis the clustering is unsupervised
in the cluster analysis and is measured with no reference variables, while in
Logistic Regress and Tree Models, the clustering is supervised and is measured against a reference variables such
as response whose levels are known (Giudici, 2005).
The Linear Regression is to examine and predict data
by modeling the relationship between the dependent variable also called
“response” variable, and the independent variable also known as “explanatory”
variable. The purpose of the Linear
Regression is to find the best statistical relationship between these variables
to predict the response variable or to examine the relationship between the
variables (Perugachi-Diaz & Knapik, 2017).
Bivariate Linear Regression can be used to evaluate whether one variable called dependent variable or the response can be caused, explained and therefore predicted as a function of another variable called independent, the explanatory variable, the covariate or the feature (Giudici, 2005). The Y is used for the dependent or response variable, and X is used for the independent or explanatory variable (Giudici, 2005). Linear Regression is the simplest statistical model which can describe Y as a function of an X (Giudici, 2005). The Linear Regression model specifies a “noisy” linear relationship between variables Y and X, and for each paired observation (xi, yi), the following Regression Function is used (Giudici, 2005; Schumacker, 2015).
Where:
i
= 1, 2, …n
a
= The
intercept of the regression function.
b
= The
slope coefficient of the regression function
also called the regression coefficient.
ei
= the
random error of the regression function, relative to the ith observation.
The Regression Function has two main elements; the Regression Line and the Error Term. The Regression Line can be developed empirically, starting from the matrix of available data. The Error Term describes how well the regression line approximates the observed response variable. The determination of the Regression Line can be described as a problem of fitting a straight line to the observed dispersion diagram, where the Regression Line is the Linear Function using the following formula (Giudici, 2005).
Where:
= indicates the fitted ith value of the dependent variable, calculated on the basis of the ith value of the explanatory variable of xi.
The Regression Line simple formula, as indicated in (Bernard, 2011; Schumacker, 2015) is as follows:
Where:
y
= variable value of dependent variable.
a and b are some
constants.
x
= the
variable value of the independent variable.
The Error Term of ei in the expression of the Regression Function represents, for each observation yi, the residual, namely the difference between the observed response values yi, and the corresponding values fitted with the Regression Line using the following formula (Giudici, 2005):
Each residual can be interpreted as the part of the corresponding value that is not explained by the linear relationship with the explanatory variable. To obtain the analytic expression of the regression line, it is sufficient to calculate the parameters a and b on the basis of the available data. The method of least square is often used for this. It chooses the straight line which minimizes the sum of squares of the errors of the fit (SSE), defined by the following formula (Giudici, 2005).
Figure 2 illustrates the representation of the
regression line.
Figure 2. Representation of the Regression Line (Giudici, 2005).
General Least Square Model (GLM) for Regression and Correlations
The Linear Regression is based on the Gauss-Markov theorem, which states that if the errors of prediction are independently distributed, sum to zero and have constant variance, then the least squares estimation of the regression weight is the best linear unbiased estimator of the population (Schumacker, 2015). The Gauss-Markov theorem provides the rule that justifies the selection of a regression weight based on minimizing the error of prediction, which gives the best prediction of Y, which is referred to as the least squares criterion, that is, selecting regression weights based on minimizing the sum of squared errors of prediction (Schumacker, 2015). The least squares criterion is sometimes referred to as BLUE, or Best Linear Unbiased Estimator (Schumacker, 2015).
Several assumptions are
made when using Linear Regression, among which is one crucial assumption known as “independence
assumption,” which is satisfied when the observations are taken on subjects which are not
related in any sense (Perugachi-Diaz & Knapik, 2017). Using this
assumption, the error of the data can be assumed to be independent (Perugachi-Diaz & Knapik, 2017). If this assumption is violated, the errors exist
to be dependent, and the quality of
statistical inference may not follow from the classical theory (Perugachi-Diaz & Knapik, 2017).
Regression works by trying to fit a straight line
between these data points so that the
overall distance between points and the line is minimized using the statistical
method called least square. Figure 3 illustrates an example of a Scatter Plot of two variables, e.g., English and Maths Scores (Muijs, 2010).
Figure 3. Example of a Scatter Plot of two Variables, e.g. English and Maths Scores (Muijs, 2010).
In Pearson’s correlation, ( r ) measures how much
changes in one variable correspond with equivalent
changes in the other variables (Bernard, 2011). It can also be
used as a measure of association between an interval and an ordinal variable or
between an interval and a dummy variable which are nominal variable coded as 1
or 0, present or absent (Bernard, 2011). The square of Pearson’s r or r-squared is a PRE (proportionate reduction of error) measure of
association for linear relations between interval variables (Bernard, 2011). It indicates how much better the scores of a
dependent variable can be predicted if
the scores of some independent variables are known (Bernard, 2011). The dots illustrated in Figure 4 is physically
distant from the dotted mean line by a
certain amount. The sum of the squared distances to the mean is the smallest
sum possible which is the smallest cumulative prediction error giving the mean
of the dependent is only known (Bernard, 2011). The distance from the dots above the line to
the mean is positive; the distances from
the dots below the line to the mean are negative (Bernard, 2011). The sum of the actual distances is zero. Squaring the distances gets rid of the
negative numbers (Bernard, 2011). The solid line that runs diagonally through
the graph in Figure 4 minimizes the prediction error for these data. This line is called the best fitting line, or
the least square line, or the regression line (Bernard, 2011).
Figure 4. Example of a Plot of Data of TFR and “INFMORT” for Ten countries (Bernard, 2011).
Transformation of Variables for Linear Regression
The transformation of the data can involve the data transformation of the data matrix in univariate and multivariate frequency distributions (Giudici, 2005). It can also involve a process to simplify the statistical analysis and the interpretation of the results (Giudici, 2005). For instance, when the p variables of the data matrix are expressed in different measurement units, it is a good idea to put all the variables into the same measurement unit so that the different measurement scales do not affect the results (Giudici, 2005). This transformation can be implemented using the linear transformation to standardize the variables, taking away the average of each one and dividing it by the square root of its variance (Giudici, 2005). There is other data transformation such as the non-linear Box-Cox transformation (Giudici, 2005).
The transformation of the data is also a method of
solving problems with data quality, perhaps because items are missing or
because there are anomalous values, known
as outliers (Giudici, 2005). There are two primary
approaches to deal with missing data; remove it, or substitute it using the
remaining data (Giudici, 2005). The identification of anomalous values
requires a formal statistical analysis; an
anomalous value can seldom be eliminated
as its existence often provides valuable
information about the descriptive or predictive model connected to the data
under examination (Giudici, 2005).
The underlying concept behind the transformation of
the variables is to correct for distributional problems, outliers, lack of
linearity or unequal variances (Field, 2013). The transformation of the variables changes
the form of the relationships between variables, but the relative differences
between people for a given variable stay the same. Thus, those relationships can still be quantified (Field, 2013). However, it does change the differences between
different variables because it changes the units of measurement (Field, 2013). Thus, in the case of a relationship between
variables, e.g., regression, the transformation is implemented at the problematic variable. However, in case of differences between variables such as a change in a variable over time, then the
transformation is implemented for all of
those variables (Field, 2013).
There are various transformation techniques to correct
various problems. Log Transformation (log(Xi)) method can be used to correct for positive
skew, positive kurtosis, unequal variances, lack of linearity (Field, 2013). Square root transformation
(ÖXi )
can be used to correct for positive skew, positive kurtosis, unequal variances,
and lack of linearity (Field, 2013). Reciprocal Transformation (1/Xi) can be used to correct
for positive skew, positive kurtosis, unequal variances (Field, 2013). The Reverse
Score Transformation can be used to correct for negative skew (Field, 2013). Table 1 summarizes these types of
transformation and their correction use.
Table 1. Transformation of Data Methods and their Use. Adapted from (Field, 2013).
Procedures in R for Linear Regressions
In R, there is a package called “stats” package which contains two different functions which can be used to estimate the intercept and slope in the linear regression equation (Schumacker, 2015). These two functions in R are lm() and lsfit() (Schumacker, 2015). The lm() function uses a data frame, while the lsfit() uses a matrix or data vector. The lm() function outputs an intercept term, which has meaning when interpreting results in linear regression. The lm() function can also specify an equation with no intercept of the form (Schumacker, 2015).
Example of lm()
function with intercept on y as
dependent variable and x as
independent variable:
LReg = lm(y ~ x, data = dataframe).
Example of lm()
function with no intercept on y as
dependent variable and x as
independent variable:
LReg = lm(y ~ 0 + x, data=dataframe) or
LReg
= lm(y ~ x – 1, data = dataframe)
The expectation
when using the lm() function is that the response variable data is distributed
normally (Hodeghatta & Nayak, 2016). However, the independent variables are not
required to be normally distributed (Hodeghatta & Nayak, 2016). Predictors can be factors (Hodeghatta & Nayak, 2016).
#cor() function to find the correlation between variables
cor(x,y)
#To build linear regression model with R
model <-lm(y ~ x, data=dataset)
References
Bernard, H. R. (2011). Research methods in anthropology:
Qualitative and quantitative approaches: Rowman Altamira.
Field, A. (2013). Discovering Statistics using IBM SPSS
Statistics: Sage publications.
Giudici, P.
(2005). Applied data mining: statistical
methods for business and industry: John Wiley & Sons.
Hodeghatta, U. R.,
& Nayak, U. (2016). Business
Analytics Using R-A Practical Approach: Springer.
Huck, S. W.,
Cormier, W. H., & Bounds, W. G. (2012). Reading
statistics and research (6th ed.): Harper & Row New York.
Kometa, S. T.
(2016). Getting Started With IBM SPSS
Statistics for Windows: A Training Manual for Beginners (8th ed.): Pearson.
Muijs, D. (2010). Doing quantitative research in education
with SPSS: Sage.
Perugachi-Diaz,
Y., & Knapik, B. (2017). Correlation in Linear Regression.
Schumacker, R. E.
(2015). Learning statistics using R:
Sage Publications.
The purpose of this project is to analyze the selected dataset of the births2006.smpl. The dataset is part of the R library “nutshell.” The project is divided into two main Parts. Part-I evaluates and examines the dataset for understanding the Dataset using the R. Part-I involves five significant tasks for the examination of the dataset. Part-II is about the Data Analysis of the dataset. The Data Analysis involves nine significant tasks. The first eight tasks involve the codes and the results with Plot Graphs, and Bar Charts for analysis. Task-9 is the last task of Part-II for discussion and analysis. The most observed results include the higher number of the birth during the working days of Tuesday through Thursday than the weekend, and the domination of the vaginal method over the C-section. The result also shows that the average birth weight gets increased among the male babies for quintuplet while the trend continues to decline among the female babies. The researcher recommends further statistical significance, and the effect size tests to verify these results and examine the interaction among specific variables such as birth weight and Apgar score.
Keywords:
Births2006.smpl; Box Plot and Graphs Analysis Using R.
This
project examines and analyzes the dataset of births2006.smpl which is part of
the Nutshell package of RStudio. This
dataset contains information on babies born in the United in the year
2006. The source of this dataset is (https://www.cdc.gov/NCHS/data_access/VitalStatsOnline.htm). There is only one record per birth. The dataset is a random ten percent sample of
the original data (RDocumentation,
n.d.). The package which is required for this
dataset is called “nutshell” in R. The
dataset contains 427,323 as shown below. There are two Parts. Part-I addresses five tasks to examine and
understand the dataset using R before the analysis as follows:
Part-II
address the analysis using R. Part-II includes seven tasks include the
following. These seven tasks are followed by the discussion and analysis of the
results.
Task-1: The first five records of the dataset.
Task-2: The Number of Birth in 2006 per day of the week in the U.S.
Task-3: The Number of Birth per Delivery Method and Day of Week in 2006 in the U.S.
Task-4: The Number of Birth based on Birth Weight and Single or Multiple Birth Using Histogram.
Task-5: The Number of Birth based on Birth Weight and Delivery Method Using Histogram.
Task-6: Box Plot of Birth Weight Per Apgar Score.
Task-7: Box Plot of Birth Weight Per Day of Week.
Task-8: The Average of Birth Weight Per Multiple Births by Gender.
The
purpose of this task is to install the nutshell package which is required for
this project. The births2006.smpl dataset is part of Nutshell package in
R.
The
purpose of this task is to understand the variables of the dataset. This dataset is part of RStudio dataset (RDocumentation,
n.d.). The main dataset is called “births2006.smpl”
dataset, which includes thirteen variables as shown in Table 1.
Table 1. The Variables of the Dataset of births2006.smpl.
This
dataset contains information on babies born in the United in the year
2006. The source of this dataset is (https://www.cdc.gov/NCHS/data_access/VitalStatsOnline.htm). There is only one record per birth. The dataset is a random ten percent sample of
the original data (RDocumentation,
n.d.). The package which is required for this
dataset is called “Nutshell” in R. The
dataset contains 427,323 as shown below.
The
purpose of this task is to examine each dataset using RConsole. The commands
which will primarily use in this section are a summary() to understand each
dataset better.
The purpose of this task is to show a
bar chart of the “frequency” for two-way classification of birth according to
the day of the week and the method of the delivery (C-section or Vaginal).
Figure 2. The Number of Births Per Delivery Method and Day of Week in 2006 in the US.
The purpose of this task is to use
“lattice” (trellis) graphs using lattice R package, to condition density
histograms on the value of a third variable. The variables for multiple births
and the method of delivery are conditioning variables. Separate the histogram
of birth weight according to these variables.
Figure 3. The Number of the Birth based on Weight and Single or Multiple Birth.
The purpose of this task is to use
“lattice” (trellis) graphs using lattice R package, to condition density
histograms on the value of a third variable. The variables for multiple births
and the method of delivery are conditioning variables. Separate the histogram
of birth weight according to these variables.
Figure 4. The Number of the Birth based on Birth Weight and Delivery Method.
The purpose of this task is to calculate
the average birth weight as a function of multiple births for males and females
separately. In this task, the tapply function is
used, and the option na.rm=TRUE is used for missing values.
Figure 7. Bar Plot of Average Birth Weight Per Multiple Births by Gender.
For the number of the births in 2006
per day of the week in United States, giving for Sunday (1) through the week
until Saturday is (7), the result (Figure 1) shows that the highest number of
births, which seems to be very close, happens in the working days of 3, 4, and
5, Tuesday, Wednesday, and Thursday respectively. The least number of birth is observed on
day 1 (Sunday), followed by day 7 (Saturday), day 2 (Monday) and day 6
(Friday).
For the number of births per delivery
method for (C-section vs. vaginal), and the day of the week in 2006 in the United States, the result (Figure 2) shows that the vaginal method is dominating
the delivery methods and has the highest ranks in all weekdays in comparison with C-section. The same high number of the birth per day in
the vaginal method are the working days
of Tuesday, Wednesday, and Thursday. The
least number of birth per day in the vaginal
method is on Sunday, followed by Saturday, Monday, and Friday. The highest
number of birth in C-section is observed on Friday, followed by Tuesday through
Thursday. The least number of birth per
day in C-section is still on Sunday, followed by Saturday and Monday.
For the number of births based on
birth weight and single or multiple births (twin, triplet, quadruplet, and
quintuplet or higher), the result (Figure 3) shows that the single birth
frequency has almost a normal distribution.
However, the more birth such as twin, triplet, quadruplet, and quintuplet or higher, the more distribution
moves toward the left indicating less weight.
Thus, this result can suggest that the more birth (twin, triplet,
quadruplet, and quintuplet or more) have
lower birth rates on average.
For the number of
births based
on the birth weight and delivery method, the result (Figure 4) shows that the
vaginal and C-section have almost the same distribution. However, the vaginal shows a higher percent
total than the C-section. The unknown
delivery method is an almost the same pattern of distribution of vaginal and
C-section. More analysis is required to
determine the effect of the weight on the delivery method and the rate of the
birth.
The Apgar
score is a scoring system used by doctors
and nursed to evaluate newborns one minute and five minutes after the baby is
born (Gill,
2018).
The Apgar scoring system is divided into five categories:
activity/muscle tone, pulse/heart rate, grimace, appearance, and
respiration/breathing. Each category receives a score of 0 to 2 points. At most, a child will receive an overall
score of 10 (Gill,
2018). However, a baby rarely scores a 10
in the first few moments of life, because most babies have blue hands or feet
immediately after the birth (Gill,
2018).
For the birth weight per Apgar score, the result (Figure 5) shows that
the median is almost the same or close among the birth weight for Apgar score of 3-10. The median for birth weight of Apgar score of 0 and 2 is close, while the
least median is the Apgar score 1 within the same range of the birth weight of
0-2000 gram. However, the birth weight
from 2000-4000 gram, the median of the birth weight is close to each other for
the Apgar score from 3-10, almost ~3000
gram. The birth weight distribution
varies, as it is more distributed between ~1500 to 2300 grams, the closer to Apgar score 10, the birth weight moves between
~2500 to ~3000 grams. There are outliers
in distribution for Apgar score 8 and
9. These outliers show heavyweight
babies above 6000 grams with Apgar score of 8-9. As the Apgar
score increases, the more outliers than the distribution of lower Apgar scores.
Thus, more analysis using statistical significance tests and effect size
can be performed for further investigation of these two variables
interaction.
For the birth weight per day of the week,
the result (Figure 6) shows that there is a normal distribution for the seven
days of the week. The median of the birth weight for all days is almost the
same. The minimum, the maximum, and the range
of the birth weight have also a normal distribution among the days of the
week. However, there are outliers in the
birth weight for the working days of Tuesday, Wednesday, and Thursday.
There are additional outliers in the birth weight on Monday, as well as
on Saturday but fewer outliers than the
working days of Tues-Thurs. This result
indicates that there is no relationship between the birth weight and the days
of the week, as the heavyweight babies
above 6000 grams reflecting the outliers tend to occur with no regard to the
days of the week.
For the average of the birth weight per
multiple births by gender, the result (Figure 7) shows that the single birth
has the highest birth weight for the male and female of ~3500 grams. The birth weight tends to decrease for
“twin,” “triplet” for male and female.
However, the birth weight shows a decrease in the female and more
decrease in male than female in “quadruplet.”
The more observed result is shown in the male gender babies as the birth
weight gets increased for the “quintuplet or higher,” while the birth weight
for female continues to decline for the same category of “quintuplet or
higher.” This result confirms the result
of the impact of the multiple births on the birth weight as discussed earlier
and illustrated in Figure 3.
In summary, the analysis of the
dataset of births2006.smpl using R indicates that frequency of birth tends to focus more on the working days than
the weekends, and the vaginal tends to dominate the delivery methods. Moreover, the frequency of the birth based on
birth weight and single or multiple births
shows that the single birth has more normal distribution than the other
multiple births. The vaginal and
C-section have shown almost similar distribution. The birth weight per Apgar score is between
~2500-3000 grams and close among the Apgar
score of 8-10. The days of the week does
not show any difference in the birth weight. Moreover, the birth weight per
gender shows that the birth weight tends to decrease by multiple births among females and males, except only for
the quintuplet, where it tends to decrease in a female
while it increases in males. This result
of the increasing birth weight among male birth for quintuplet or higher
requires more investigation to evaluate the reasons and causes for such an increase in the birth weight. The researcher recommends further statistical
significance, and the effect size tests
verify these results.
Conclusion
The project analyzed the selected
dataset of the births2006.smpl. The
dataset is part of the R library “nutshell.” The project is divided into two main Parts. Part-I evaluated and examined the dataset for understanding the Dataset using the R. Part-I involved five major tasks for the examination of the dataset. Part-II addressed the
Data Analysis of the dataset. The Data
Analysis involved nine major tasks. The first eight tasks involved the codes and
the results with Plot Graphs, and Bar Charts for analysis. The discussion and the analysis were addressed in Task-9. The most observed results showed that the
number of the birth increases during the working days of Tuesday through
Thursday over the weekend and the vaginal
method is dominating over the C-section.
The result also showed that the average birth weight gets increased
among the male babies for quintuplet while the trend continues to decline among
the female babies. The researcher recommends further statistical significance, and the effect size tests to verify these
results and examine the interaction among certain
variables such as birth weight and Apgar score.
The purpose of this discussion is to discuss the supervised learning and how it can be used in large datasets to overcome the problem where everything is significant with statistical analysis. The discussion also addresses the importance of a clear purpose of supervised learning and the use of random sampling.
Supervised Learning (SL) Algorithm
In accordance with the (Hall, Dean, Kabul, & Silva, 2014), SL “refers to techniques that use labeled data to train a model.” It is comprised of “Prediction” (“Regression”) algorithm, and “Classification” algorithm. The “Regression” or “Prediction” algorithm is used for “interval labels,” while the “Classification” algorithm is used for “class labels” (Hall et al., 2014). In the SL algorithm, the training data represented in observations, measurements, and so forth are associated by labels reflecting the class of the observations (Han, Pei, & Kamber, 2011). The new data is classified based on the “training set” (Han et al., 2011).
The “Predictive Modeling” (PM) operation
of the “Data Mining” utilizes the same concept of the human learning by using
the observation to formulate a model of specific characteristics and phenomenon
(Coronel
& Morris, 2016).
The analysis of an existing database to determine the essential characteristics “model” about the
data set can implement using the PM
operation (Coronel
& Morris, 2016).
The (SL) algorithm develops these key characteristics represented in a
“model” (Coronel
& Morris, 2016).
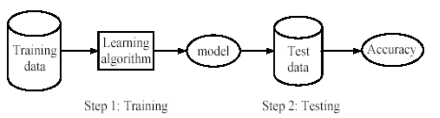
The SL approach has two phases: (1) Training Phase, and (2) Testing
Phase. In the “Training Phase,” a model utilizing a large sample of
historical data called “Training Set” is developed. In the “Testing Phase,” the model is tested on new, previously unseen data, to determine
the accuracy and the performance characteristics. The PM operation involves two approaches: (1)
Classification Technique, and (2) Value Prediction Technique (Connolly
& Begg, 2015).
The nature of the predicted variables distinguish both techniques of the
classification and value prediction (Connolly
& Begg, 2015).
The “Classification Technique”
involves two specializations of
classifications: (1) “Tree Induction,”
and (2) “Neural Induction” which are used
to develop a predetermined class for each
record in the database from a set of possible class values (Connolly
& Begg, 2015).
The application of this approach can answer questions like “What is the
probability for those customers who are renting to be interested in purchasing
home?”
The “Value Prediction,” on the other
hand, implements the traditional statistical methods of (1) “Linear
Regression,” and (2) “Non-Linear Regression” which are used to estimate a
continuous numeric value that is associated
with a database record (Connolly
& Begg, 2015).
The application of this approach can be
used for “Credit Card Fraud Detection,” and “Target Mailing List
Identification” (Connolly
& Begg, 2015).
The limitation of this approach is that the “Linear Regression” works
well only with “Linear Data” (Connolly
& Begg, 2015). The application of the PM
operation includes the (1) “Customer Retention Management,” (2) “Credit
Approval,” (3) “Cross-Selling,” and (4) “Direct Marketing” (Connolly
& Begg, 2015). Furthermore, the Supervised methods such as
Linear Regression or Multiple Linear Regression can be used if there exists a strong
relationship between a response variable and various predictors (Hodeghatta
& Nayak, 2016).
Clear Purpose of Supervised Learning
The purpose of the supervised learning must be clear before the implementation of the data mining process. Data mining process involves six steps in accordance to (Dhawan, 2014). They are as follows.
The
first step includes the exploration of the data
domain. To achieve the expected result,
understanding and grasping the domain of the application assist in accumulating
better data sets that would determine the data mining technique to be
applied.
The
second phase includes
the data collection. In the data
collection stage, all data mining algorithms are
implemented on some data sets.
The
third phase involves
the refinement and the transformation of the data. In this stage, the datasets will get more
refined to remove any noise, outliner, missing values, and other inconsistencies.
The refinement of the data is followed
by the transformation of the data for further processing for analysis and
pattern extraction.
The
fourth step involves the feature selection. In this stage, relevant features are selected
to apply further processing.
The
fifth stage involves the application of the relevant
algorithm. After the data is acquired,
cleaned and features are selected, in
this step, the algorithm is selected to process the data and produce
results. Some of the commonly used
algorithms include (1) clustering algorithm, (2) association rule mining
algorithm, (3) decision tree algorithm, and (4) sequence mining algorithm.
The
last phase involves the observation, the analysis, and
the evaluation of the data. In this
step, the purpose is to find a pattern in the result produced by the
algorithm. The conclusion is typically based
on the observation and evaluation of the data.
Classification is one of the data mining techniques. Classification based data mining exists as
the cornerstone of the machine learning
in artificial intelligence (Dhawan, 2014). The process in the Supervised Classification begins with given sample data, also known as a training set, consists of multiple entries,
each with multiple features. The purpose
of this supervised classification is to analyze the sample data and to develop
an accurate understanding or model for each class using the attributes present
in the data. This supervised
classification is used to classify and label test data. Thus, the precise
purpose of the supervised classification is very critical to analyze the sample
data and develop an accurate model for
each class using the attributes present in the data. Figure 1 illustrates the supervised
classification technique in data mining as depicted in (Dhawan, 2014).
Figure 1: Linear Overview of steps involved in Supervised Classification (Dhawan, 2014)
The conventional
techniques employed in the Supervised Classification involves the known
algorithms of (1) Bayesian Classification, (2) Naïve Bayesian Classification,
(3) Robust Bayesian Classifier, and (4) Decision Tree Learning.
Various Types of Sampling
A sample of records can be taken for any analysis unless the dataset is driven from a big data infrastructure (Hodeghatta & Nayak, 2016). A randomization technique should be used, and steps must be taken to ensure that all the members of a population have an equal chance of being selected (Hodeghatta & Nayak, 2016). This method is called probability sampling. There are various variations on this sampling type: Random Sampling, Stratified Sampling, and Systematic Sampling (Hodeghatta & Nayak, 2016), cluster, and multi-stage (Saunders, 2011). In Random Sampling, a sample is picked randomly, and every member has an equal opportunity to be selected. In Stratified Sampling, the population is divided into groups, and data is selected randomly from a group or strata. In Systematic Sampling, members are selected systematically, for instance, every tenth member of that particular time or event (Hodeghatta & Nayak, 2016). The most appropriate sampling technique to obtain a representative sample should be implemented based on the research question(s) and the objectives of the research study (Saunders, 2011).
In summary,
supervised learning is comprised of
Prediction or Regression, and Classification. In both approaches, a clear
understanding of the SL is critical to analyze the sample data and develop an
accurate understanding or model for each class using the attributes present in
the data. There are various types of
sampling: random, stratified and
systematic. The most appropriate
sampling technique to obtain a representative sample should be implemented
based on the research question(s) and the objectives of the research
study.
References
Connolly, T., & Begg, C. (2015).
Database Systems: A Practical Approach to
Design, Implementation, and Management (6th Edition ed.): Pearson.
Dhawan, S.
(2014). An Overview of Efficient Data
Mining Techniques. Paper presented at the International Journal of Engineering
Research and Technology.
Hall, P., Dean,
J., Kabul, I. K., & Silva, J. (2014). An Overview of Machine Learning with
SAS® Enterprise Miner™. SAS Institute Inc.
Han, J., Pei, J.,
& Kamber, M. (2011). Data mining:
concepts and techniques: Elsevier.
Hodeghatta, U.
R., & Nayak, U. (2016). Business
Analytics Using R-A Practical Approach: Springer.
Saunders,
M. N. (2011). Research methods for
business students, 5/e: Pearson Education India.
The purpose of this discussion is to compare the statistical features of R to its programming features. The discussion also outlines the programming features available in R in a table format. Furthermore, the discussion describes how the analytics of R are suited for Big Data. We will begin by defining R followed by the comparison.
What
is R?
R is defined in (r-project.org, n.d.) as “language and
environment for statistical computing and graphics.” The R system for
statistical computing is used for data
analysis and graphics (Hothorn & Everitt, 2009; Venables, Smith, &
Team, 2017).
It is also described as an
integrated suite of software facilities for data manipulation, calculation and
graphical display (Venables et al., 2017). The root of R is the S language, developed by
John Chambers and colleagues at Bell Laboratories (formerly AT&T, now owned by
Lucent Technologies) starting in the 1960s (Hothorn & Everitt, 2009; r-project.org, n.d.;
Venables et al., 2017).
The S language was designed and
developed as a programming language for data analysis. While S
language is a full-features of programming language (Hothorn & Everitt, 2009; r-project.org, n.d.), R provides a
wide range of statistical techniques such as linear and non-linear modeling,
classical statistical tests, time-series analysis, classification, clustering
and so forth (Venables et al., 2017; Verzani, 2014). It also provides graphical techniques and is
highly extensible (Hothorn & Everitt, 2009; r-project.org, n.d.). It is available as Free Software under the
terms of the Free Software Foundation’s GNU General Public License (r-project.org, n.d.). R has become the
“lingua franca” or common language of statistical computing (Hothorn & Everitt, 2009). It is becoming the primary computing engine for reproducible statistical research
because of its open source availability and its dominant
language and graphical capabilities (Hothorn & Everitt, 2009). It is
developed for Unix-like, Windows and Mac families of the operating system (Hornik, 2016; Hothorn & Everitt, 2009;
r-project.org, n.d.; Venables et al., 2017).
The R system provides an
extensive, coherent, integrated collection of intermediate tools for
data analysis. It also provides graphical facilities for data analysis and displays either directly on the computer or on hard-copy. The term “environment” in R is to
characterize R as a fully planned and
coherent system, rather than an incremental accretion of specific and inflexible tools as the case with
other data analysis software (Venables et al., 2017). However, most programs written in R are
written for a single piece of data analysis and inherently
ephemeral (Venables et al., 2017). The R system provides the most classical statistics and much of the
latest methodology (Hothorn & Everitt, 2009; Venables et al., 2017). Furthermore,
the R system has a well-developed, simple and effective programming language
which includes conditionals, loops, user
defined recursive functions and input and output facilities (Venables et al., 2017). As observed, R has various advantages which
makes it a powerful tool to use for data
analysis.
Statistical Features vs Programming Features
With R, several statistical tests and methods can be performed such as two-sample tests, hypothesis testing, z-test, t-test, chi-square tests, regression analysis, multiple linear regression, analysis of variance, and so forth (Hothorn & Everitt, 2009; r-project.org, n.d.; Schumacker, 2014; Venables et al., 2017; Verzani, 2014). With respect to the programming features, R is an interpreted language, and it can be accessed through a command line interpreter. The R supports matrix arithmetic. It supports procedural programming with functions and object-oriented programming with generic functions. Procedural programming includes procedure, records, modules and procedure calls. It has useful data handling and storage facilities. Packages are part of R programming and are useful in collecting sets of R functions into a single unit. The programming features of R include database input, exporting data, viewing data, variable labels, missing data and so forth. R also supports a large pool of operators for performing operations on arrays and metrics. It has facilities to print the reports for the analysis performed in the form of graphs either on-screen or on hardcopy (Hothorn & Everitt, 2009; r-project.org, n.d.; Schumacker, 2014; Venables et al., 2017; Verzani, 2014). Table 1 summarizes these features.
Table 1. Summary of the Programming Features and Statistical Features in R.
Big
Data Analytics Using R: Big
Data has attracted the attention of various sectors, researchers, academia,
government and even the media (Chen,
Mao, & Liu, 2014; Géczy, 2014; Kaisler, Armour, Espinosa, & Money,
2013).
Such attention is driven by the
value and the opportunities that can be derived
from Big Data. The importance of Big
Data has been evident in almost every sector.
There are various
advanced analytical theories and methods which can be utilized in Big Data in different fields such as Medical,
Finance, Manufacturing, Marketing, and
more. These six analytical models are Clustering, Association Rules, Regression, Classification, Time Series Analysis, and
Text Analysis (EMC, 2015).
The Cluster, Regression and Classification models can be used in the Medical field. The
Classification model with the Decision Tree and Naïve Bayes method has been
used to diagnose patients with specific
diseases such as heart disease, and the probability of a patient having a specific disease. As an example, in (Shouman, Turner, & Stocker, 2011), the researchers performed various experimentations to evaluate
the Decision Tree in the diagnosis of the heart disease. The key benefit of the study was the
implementation of multi-variants while using various types of Decision Tree
types such as Information Gain, Gini
Index, and Gain Ratio. The study also
performed the experimentation with and without the voting technique.
Furthermore, there are four major
analytics types: Descriptive Analytics,
Predictive Analytics, Prescriptive Analytics (Apurva, Ranakoti, Yadav, Tomer, & Roy, 2017; Davenport
& Dyché, 2013; Mohammed, Far, & Naugler, 2014),
and Diagnostic Analysis (Apurva et al., 2017).
The Descriptive Analytics are used to summarize historical data to provide useful information. The Predictive Analytics is used to predict
future events based on the previous behavior using the data mining techniques
and modeling. The Prescriptive Analytics provides support to use various
scenarios of data models such as multi-variables
simulation, detecting a hidden
relationship between different variables.
It is useful to find an optimum
solution and the best course of action
using the algorithm.
Moreover, many organizations have employed Big Data and Data Mining in some areas including fraud detection. Big Data Analytics can empower healthcare industry in fraud detection to mitigate the impact of the fraudulent activities in the industry. Several use cases such as (Halyna, 2017; Nelson, 2017) have demonstrated the positive impact of integrating Big Data Analytics into the fraud detection system. Big Data Analytics and Data Mining have various techniques such as classification model, regression model, and clustering model. The classification model employs logistic, tree, naïve Bayesian, and neural network algorithms. It can be used for fraud detection. The regression model employs linear ad k-nearest-neighbor. The clustering model employs k-means, hierarchical and principal component algorithms. For instance, in (Liu & Vasarhelyi, 2013), the researchers applied the clustering technique using an unsupervised data mining approach to detect the fraud of insurance subscribers. In (Ekina, Leva, Ruggeri, & Soyer, 2013), the researchers applied the Bayesian co-clustering with unsupervised data mining method to detect conspiracy fraud which involved more than one party. In (Capelleveen, 2013), the researchers employed the outlier detection technique using an unsupervised data mining method to detect dental claim data within Medicaid. In (Aral, Güvenir, Sabuncuoğlu, & Akar, 2012), the researchers used distance-based correlation using hybrid supervised and unsupervised data mining methods for prescription fraud detection. These research studies and use cases are examples of taking advantages of Big Data Analytics in healthcare fraud detection. Thus, it is proven that Big Data Analytics can play a significant role in various sectors such as healthcare fraud detection.
Therefore, giving the nature of BD and BDA, and the
nature of R language, which can be integrated
with other languages such as SQL, Hadoop (Prajapati, 2013), Spark (spark.rstudio.com, 2018), R is becoming
the primary workhorse for statistical analyses (Hothorn & Everitt, 2009), which can be
used for BDA as discussed above.
Statistical methods not only help make scientific discoveries, but also
quantifies the reliability, reproducibility, and general uncertainty associated
with these discoveries (Ramasubramanian & Singh, 2017). Examples of using R with BDA include (Matrix, 2006), which analyzed
customer behavioral data to identify unique and actionable segments of the
customer base. Another example includes (Gentleman, 2005) using R in genetics
and molecular biology use case.
In summary, the R
system offers various features such as programming and statistical features
which help in data analysis. Big Data
has various types of analytics such as clustering, association rules,
regression, classification, time series analysis and text analysis. Most of these analyses are statistical based
which can be leveraged by using the R language.
R has been used in various BDA
sectors such as healthcare and fraud detection.
References
Apurva, A., Ranakoti, P., Yadav, S.,
Tomer, S., & Roy, N. R. (2017, 12-14 Oct. 2017). Redefining cyber security with big data analytics. Paper presented
at the 2017 International Conference on Computing and Communication
Technologies for Smart Nation (IC3TSN).
Aral, K. D.,
Güvenir, H. A., Sabuncuoğlu, İ., & Akar, A. R. (2012). A prescription fraud
detection model. Computer methods and
programs in biomedicine, 106(1), 37-46.
Capelleveen, G.
C. (2013). Outlier based predictors for
health insurance fraud detection within US Medicaid. The University of
Twente.
Chen, M., Mao,
S., & Liu, Y. (2014). Big data: a survey. Mobile Networks and Applications, 19(2), 171-209.
Davenport, T. H.,
& Dyché, J. (2013). Big data in big companies. International Institute for Analytics.
Ekina, T., Leva,
F., Ruggeri, F., & Soyer, R. (2013). Application of Bayesian methods in the
detection of healthcare fraud.
EMC. (2015). Data Science and Big Data Analytics:
Discovering, Analyzing, Visualizing and Presenting Data. (1st ed.): Wiley.
Géczy, P. (2014).
Big data characteristics. The Macrotheme
Review, 3(6), 94-104.
Gentleman, R.
(2005). Reproducible research: A bioinformatics case study.
Hothorn, T.,
& Everitt, B. S. (2009). A handbook
of statistical analyses using R: Chapman and Hall/CRC.
Kaisler, S.,
Armour, F., Espinosa, J. A., & Money, W. (2013). Big data: issues and challenges moving forward. Paper presented at
the System Sciences (HICSS), 2013 46th Hawaii International Conference on
System Sciences.
Liu, Q., &
Vasarhelyi, M. (2013). Healthcare fraud
detection: A survey and a clustering model incorporating Geo-location
information.
Matrix, L.
(2006). Using R for Customer Analytics: A Practical Introduction to R for
Business Analysts. (2006).
Mohammed, E. A.,
Far, B. H., & Naugler, C. (2014). Applications of the MapReduce Programming
Framework to Clinical Big Data Analysis: Current Landscape and Future Trends. BioData mining, 7(1), 1.
Ramasubramanian,
K., & Singh, A. (2017). Machine
Learning Using R: Springer.
Schumacker, R. E.
(2014). Learning statistics using R:
Sage Publications.
Shouman, M.,
Turner, T., & Stocker, R. (2011). Using
decision tree for diagnosing heart disease patients. Paper presented at the
Proceedings of the Ninth Australasian Data Mining Conference-Volume 121.
The purpose of
this project is to develop a proposal for Big Data Analytics (BDA) in
healthcare. The proposal covers three
major parts. Part 1 covers Big Data Analytics Business Plan in Healthcare. Part
2 addresses Security Policy Proposal in Healthcare. Part 3 proposes Business Continuity and
Disaster Recovery Plan in Healthcare.
The project begins with Big Data Analytics Overview Healthcare, discussing the opportunities and challenges in
healthcare, and the Big Data Analytics Ecosystem overview in healthcare. The
project covers four major component of the BDA Business Plan. Big Data
Management is the first building block with detailed discussion on the data
store types which the healthcare organization must select based on their
requirements, and a use case to demonstrate the complexity of this task. Big Data Analytics is the second Building
Block which covers the technologies and tools that are required when dealing
with BDA in healthcare. Big Data
Governance is the third building block which must be implemented to ensure data
protection and compliance with the existing rules. The last building block is the Big Data
Application with a detailed discussion of the methods which can be used when using BDA
in healthcare such as clustering, classifications, machine learning and so
forth. The project also proposes a
Security Policy in comprehensive discussion of Part 2. This part discusses in details various
security measures as part of the Security Policy such as compliance with CIA
Triad, Internal Security, Equipment Security, Information
Security, and Protection techniques. The
last Part covers Business Continuity and Disaster Recovery Plan in Healthcare,
and the best practice.
Keywords:
Big Data Analytics, Healthcare, Security Policy, Business
Continuity, Disaster Recovery.
Healthcare generates various types of data from various
sources such as physician notes, X-Rays reports, Lab reports, case history,
diet regime, list of doctors and nurses, national health register data,
medicine and pharmacies, medical tools, materials and instruments expiration
data identification based on RFID data (Archenaa & Anita, 2015; Dezyre, 2016; Wang, Kung, &
Byrd, 2018). Thus, there has been an exponentially increasing trend in generating
healthcare data, which resulted in an expenditure of 1.2 trillion towards
healthcare data solutions in the healthcare industry (Dezyre, 2016). The healthcare organizations rely on Big Data
technology to capture this healthcare information about the patients to gain
more insight into the care coordination,
health management, and patient engagement.
As cited in (Dezyre, 2016), McKinsey
projects the use of Big Data in the healthcare
industry can minimize the expenses associated with healthcare data management
by $300-$500 billion, as an example of the benefits from using BD in
healthcare.
This
project discusses and analyzes various aspects of the Big Data Analytics in
Healthcare. It begins with an overview of Big Data Analytics, its benefits and
challenges in healthcare, followed by the
Big Data Analytics Framework in Healthcare.
The primary discussion and
analysis focus on three major components of
this project; the Database component of the Framework, the Security Policy
component, and Disaster Recovery Plan component. These
three significant components play
significant roles in BDA in the healthcare industry.
The healthcare
industry is continuously generating a large
volume of data resulting from record keeping, patients related data, and
compliance. As indicated in (Dezyre, 2016), the US
healthcare industry generated 150 billion gigabytes, which is 150 Exabytes of data in 2011. In the era of information technology and
digital world, the digitization of the data is becoming mandatory. The analysis of such large volume of the data
is critically required to improve the quality of healthcare, minimize the
healthcare related costs, and respond to any challenges effectively and promptly.
Big Data Analytics (BDA) offers excellent
opportunities in the healthcare industry to discover patterns and relationships
using the machine learning algorithms to
gain meaningful insights for sound decision making (Jee & Kim, 2013). Although BDA provides great benefits to healthcare, the application of BDA is confronted with various challenges. The following two sections summarize some of
the benefits and challenges.
Various research studies and reports
discussed and analyzed various benefits of BDA in Healthcare. These benefits include providing patient-centric services. Healthcare organizations can employ BDA in
various areas such as detecting diseases at an early
stage, providing evidence-based medicine, minimizing the doses of the drugs to
avoid side effects, and delivering effective
medicine based on genetic makeups. The
use of BDA can reduce the re-admission rates and thereby the healthcare related
costs for the patients are also reduced.
BDA can also be used in the healthcare
industry to detect spreading diseases earlier before the disease gets spread
using real-time analysis. The analysis
includes social logs of the patients who suffer from a disease in a particular
geographical location. This analytical process can assist healthcare
professionals to provide to the community to
take the preventive measures. Moreover,
BDA is also used in the healthcare
industry to monitor the quality of healthcare organizations and entities such
as hospitals. The treatment methods can
be improved using BDA by monitoring the effectiveness of medications (Archenaa & Anita, 2015; Raghupathi &
Raghupathi, 2014; Wang et al., 2018).
Moreover,
researchers and practitioners discussed various BDA techniques in healthcare to
demonstrate the great benefits of BDA in
healthcare. For instance, in (Aljumah, Ahamad, & Siddiqui, 2013), the
researchers discussed and analyzed the application of the Data Mining (DM) to
predict the modes of treating the diabetic patients. The researchers of this study concluded that
the drug treatment for young age diabetic patients could be delayed to avoid
side effects, while the drug treatment for the old age diabetic patients should
be immediate with other treatments as
there are no other alternatives
available. In (Joudaki et al., 2015; Rawte & Anuradha, 2015), the
researchers used the DM technique to detect healthcare fraud and abuse, that
cost fortunate to the healthcare industry. In (Landolina et al., 2012), the
researchers discussed and analyzed the remote monitoring technique to reduce health care use and improve the quality of care
in the heart failure patients with implantable defibrillators.
Practical
examples of the Big Data Analytics in Healthcare industry include Kaiser
Permanent implementing a HealthConnect
technique to ensure data exchange across all medical facilities and promote the
use of electronic health records. AstraZeneca and HealthCore have joined n
alliance to determine the most effective and economical treatments for some
chronic illness and common diseases based on their combined data (Fox & Vaidyanathan, 2016).
Thus, the benefits and advantages of
BDA in the healthcare industry are not questionable. Several types
of research, studies, and real
applications have proven and demonstrated the significant
benefits and the critical role of BDA in
healthcare. In a simple word, BDA is
revolutionizing the healthcare
industry.
Although BDA offers great
opportunities to healthcare industries, various challenges are emerging from
the application of BDA in healthcare.
Various research studies and reports discussed various Big Data
Analytics challenges in healthcare. As
indicated in the McKinsey report of (Groves, Kayyali, Knott, & Kuiken, 2016), the nature of
the healthcare industry itself poses challenging to BDA. In (Hashmi, 2013), three major
challenges dealing with healthcare industry are
discussed. These challenges include
the episodic culture, the data puddles, and the IT leadership. The episodic culture addresses the
conservative culture of the healthcare and the lack of the IT technologies
mindset, which created a rigid culture.
Few healthcare providers have overcome this rigid culture and begun to
use technology. However, there is still
a long way to go for technology to be the foundation in the healthcare industry. The data puddles reflect the silo nature of healthcare. Silo is described by (Wicklund, 2014) to be one of
the biggest flaws in the healthcare industry. Healthcare industry is falling behind other
industries because it is not using the technology properly, as all silos use
their way to collect data from labs, diagnosis, radiology, emergency, case
management and so forth. Collecting data from these sources is very
challenging. As indicated in (Hashmi, 2013), most
healthcare organizations lack the knowledge of
the basic concepts of data warehousing
and data analytics. Thus, until the
healthcare providers have a good understanding of the value of BDA, taking full advantage of BDA in healthcare still has a
very long way. The third challenge represents the IT leadership. The lack of the latest technologies among the
IT leadership in the healthcare industry
is a serious challenge. As the IT
professionals in health care depend on
vendors, who stores the data within their
tools and can control the access level to even IT professionals. This approach is a limiting approach to IT
advancement and knowledge of the emerging technologies and the application of
Big Data.
Other research studies argued that
it would be difficult to ensure that Big Data plays a vital role in the healthcare industry (Jee & Kim, 2013; Ohlhorst, 2012; Stonebraker,
2012). The concern is coming from the fact that Big
Data has its challenges such as the complex
nature of the emerging technologies, security and privacy risks, and the need
for professional skills. In (Jee & Kim, 2013), the
researchers found that healthcare Big Data has unique
attributes and values and poses different challenges compared to the business
sector. These healthcare challenges include
the scale and scope of healthcare data, which is growing exponentially. Healthcare Big Data can be defined using
silo, security, and variety. Security is the primary attribute of Big Data
for governments or healthcare organizations, which does require extra care and
attention in using healthcare where security, privacy, authority, and
legitimacy issues are very much concern.
The attribute of the “variety” of healthcare data from reading a chart,
to lab test result, to X-ray images developing structured, unstructured, and
semi-structured data, which is the same as the case with the business sector.
However, in the healthcare industry, most
of the healthcare data are structured such as Electronic Health Records rather
than semi-structured or unstructured.
Thus, the select of the database to store the data must be carefully
selected when dealing with BDA in healthcare. Figure 1summarizes the differences between BDA
in healthcare industry vs. business sector.
Figure 1. Big Data Analytics Challenges in Healthcare vs. Business Sector (Jee & Kim, 2013).
BDA in healthcare is more
challenging than the business sector due to the nature of healthcare industry
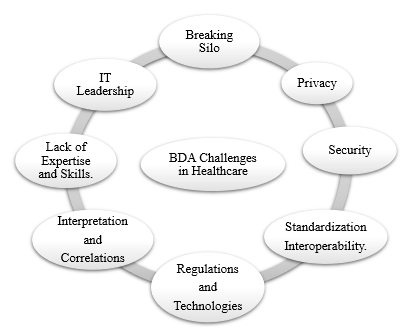
and the data it generates. In (Alexandru, Alexandru, Coardos, & Tudora, 2016), the
researchers identified six major challenges for BDA in the healthcare industry, some of which overlap with
the ones discussed earlier. The first
challenge for BDA in healthcare involves the interpretation and correlations,
especially when dealing with a complex
data structure such as healthcare dataset.
BD increases the need for standardization and interoperability in the healthcare industry, which is very challenging
because some healthcare organizations use their data and infrastructure. The security and privacy is a major concern
in the business sector. However, they
become even more concern when dealing with healthcare information, due to the
nature of healthcare industry. The data expertise and infrastructure are
required to facilitate the analytical process of the healthcare data. However,
as addressed in various studies, most of the
healthcare organizations lack such
expertise and BD and BDA. This lack of
expertise is posing challenges to BDA in healthcare. The timeliness is another
challenging aspect of BDA in healthcare, as the time is critical in obtaining
data for the clinical decision. While BD speeds up decision support and may make it more accurate based on
the collected data, care and attention to the data and the queries are very
critical to ensure that time constraints are respected while still getting
accurate answers. The last challenge is
the IT leadership which seems to be in agreement
with (Hashmi, 2013). As indicated in (Liang & Kelemen, 2016), several
challenges of BDA in healthcare are discussed
in several studies. Some of these
challenges include a data structure, data
storage and transfers, inaccuracies in data, real-time analytics, and
regulatory compliance. Figure 2 summarizes all these challenges of BDA in the healthcare industry, derived from (Alexandru et al., 2016; Hashmi, 2013; Jee & Kim,
2013; Liang & Kelemen, 2016).
Figure 2. Summary of BDA Challenges in Healthcare (Alexandru et al., 2016; Hashmi, 2013; Jee & Kim, 2013; Liang & Kelemen, 2016).
This project will not address all
these challenges due to the limited scope of this project. The scope of this project is limited only to
the Database, Security, and Disaster Recovery.
Thus, the discussion and the analysis are focusing on these three
components which are part of the challenges discussed above. Before diving into these three major topics
of this project, an overview of BDA framework in healthcare can assist in understanding
the complexity of the application of BG in healthcare.
It
is essential for healthcare organization
IT professionals to understand the framework and the topology of the BDA for
the healthcare organization to apply the security measures to protect patients’
information. The new framework for healthcare industry include the emerging new
technologies such as Hadoop, MapReduce, and
others which can be utilized to gain more insight in various areas. The traditional analytic system was not found
adequate to deal with a large volume of data such as the healthcare generated
data (Wang et al., 2018). Thus, new technologies such as Hadoop and its
major components of the Hadoop Distributed File System (HDFS), and MapReduce
functions with NoSQL databases such as HBase,
and Hive were emerged to handle a large
volume of data using various algorithms and machine learnings to extract value
from such data. Data without analytics has no value. The analytical process turns the raw data
into valuable information which can be used to save lives, predict diseases,
decrease costs, and improve the quality of the healthcare services.
Various
research studies addressed various BDA frameworks for healthcare in an attempt
to shed light on integrating the new technologies to generate value for the
healthcare. These proposed frameworks vary. For instance, in (Raghupathi & Raghupathi, 2014), the framework
involved various layers. The layers
included Data Source Layer, Transformation Layer, Big Data Platform Layer, and Big
Data Analytical Application Layer. In (Chawla & Davis, 2013), the
researchers proposed personalized
healthcare, patient-centric framework, empowering patients to take a more
active role in their health and the health
of their families. In (Youssef, 2014), the
researcher proposed a framework for secure healthcare systems based on BDA in
Mobile Cloud Computing environment. The
framework involved the Cloud Computing as the technology to be used for handling big healthcare data, the electronic health records,
and the security model.
Thus,
this project introduces the framework and the ecosystems for BDA in healthcare
organizations which integrate the data governance to protect the patients’
information at the various level of data
such as data in transit and storage. The researcher of this project is in agreement with the framework proposed by (Wang et al., 2018), as it is a
comprehensive framework addressing various data privacy protection techniques
during the analytical processing. Thus,
the selected framework for this project is based on the ecosystems and topology
of (Wang et al., 2018).
The
framework consists of significant layers
of the Data Layer, Data Aggregation Layer, Analytics Layer, Information
Exploration Layer, and Data Governance Layer. Each layer has its purpose and
its role in the implementation of BDA in the healthcare domain. Figure 3 illustrates the BDA framework for
healthcare organizations (Wang et al., 2018)
Figure 3. Big Data Analytics Framework in Healthcare (Wang et al., 2018).
The framework consists of the Data
Governance Layer that is controlling the data processing starting with capturing the data, transforming the data,
and the consumption of the data. The Data Governance Layer consists of three essential elements; the Master Data Management
element, the Data Life-Cycle Management element, and the Data Security and
Private Management element. These three significant
elements of the Data Governance Layer to
ensure the proper use of the data, the data protection from any breach and
unauthorized access.
The Data Layer represents the
capture of the data from various sources such as patients’ records, mobile
data, social media, clinical and lab results, X-Rays, R&D lab, home care
sensors and so forth. This data is captured in various types such as
structured, semi-structured and unstructured formats. The structured data represent the traditional
electronic healthcare records (EHRs). The
video, voice, and images represent the unstructured
data type. The machine-generated data
forms semi-structured data, during
transactions data including patients’ information forms structure data. These various types of data represent the
variety feature which is one of the three primary
characteristics of the Big Data (volume, velocity, and variety). The
integration of this data pools is required
for the healthcare
industry to gain significant
opportunities from BDA.
The
Data Aggregation Layer consists of three significant
steps to digest and handle the data; the acquisition of the data, the
transformation of the data, and data storage.
The acquisition step is challenging because it involves reading the data
from various communication channels including frequencies, sizes, and formats.
As indicated in (Wang et al., 2018), the
acquisition of the data is a significant
obstacle in the early stage of BDA implementation as the captured data has
various characteristics, and budget may get exceeded to expand the data
warehouse to avoid bottlenecks during the workload. The transformation step involves various
process steps such as the data moving step, the cleaning step, splitting step,
translating step, merging step, sorting step, and validating data step. After the data gets transformed using various
transformation engines, the data are loaded into storage such as HDFS or in Hadoop Cloud for further processing and
analysis. The principles of the data
storage are based on compliance
regulations, data governance policies and access controls. The data storage techniques can be
implemented and completed using batch process or during the real-time.
The Analytics Layer involves three central operations; the Hadoop MapReduce,
Stream Computing, and in-database analytics based on the type of the data. The MapReduce operation is the most popular
BDA technique as it provides the capability to process a large volume of data in the batch form in a cost-effective fashion and to
analyze various types of data such as structured and unstructured data using massively parallel processing (MPP). Moreover, the analytical process can be at
the real-time or near real time. With respect to the real-time data analytic
process, the data in motion is tracked,
and responses to unexpected events as they occur and determine the next-best actions quickly. Example include the healthcare fraud
detection, where stream computing is a critical
analytical tool in predicting the likelihood of illegal transactions or
deliberate misuse of the patients’ information.
With respect to the in-database
analytic, the analysis is implemented through the Data Mining technique using
various approaches such as Clustering, Classification, Decision Trees, and so
forth. The Data Mining technique allows data to be
processed within the Data Warehouse providing high-speed
parallel processing, scalability, and optimization features with the aim to
analyze big data. The results of the
in-database analytics process are not current or real-time. However, it
generates reports with a static prediction, which can be used in healthcare to
support preventive healthcare practices
and improving pharmaceutical management.
This Analytic Layer also provides significant support for evidence-based medical practices by analyzing
electronic healthcare records (EHRs), care experience, patterns of care,
patients’ habits, and medical histories (Wang et al., 2018).
In the Information Exploration Layer,
various visualization reports, real-time information monitoring, and meaningful
business insights which are derived from
the Analytics Layer are generated to assist organizations in making better
decisions in a timely fashion. With respect to healthcare organizations, the
most critical reporting involves
real-time information monitoring such as alerts and proactive notification, real-time data navigation, and operational
key performance indicators (KPIs). The
analysis of this information is implemented
from devices such as smartphones, and
personal medical devices which can be sent to interested users or made
available in the form of dashboards in real-time for monitoring patients’
health and preventing accidental medical events. The value of remote monitoring is proven for
diabetes as indicated in (Sidhtara, 2015), and for heart
diseases, as indicated in (Landolina et al., 2012).
Healthcare
can benefit from Big Data Analytics in various domains such as decreasing the
overhead costs, curing and diagnosing diseases, increasing the profit,
predicting epidemics and heading the quality of human life (Dezyre, 2016). Healthcare organizations have been generating
the substantial volume of data mostly
generated by various regulatory requirements, record keeping, compliance and
patient care. There is a projection from
McKinsey that Big Data Analytics in Healthcare can decrease the costs
associated with data management by $300-$500 billion. Healthcare data includes electronic health
records (EHR), clinical reports, prescriptions, diagnostic reports, medical
images, pharmacy, insurance information such as claim and billing, social media
data, and medical journals (Eswari, Sampath, & Lavanya, 2015; Ward, Marsolo,
& Froehle, 2014).
Various
healthcare organizations such as scientific research labs, hospitals, and other medical organizations are leveraging
Big Data Analytics to reduce the costs associated with healthcare by modifying
the treatment delivery models. Some of
the Big Data Analytics technologies have been
applied in the healthcare
industry. For instance, Hadoop
technology has been used in healthcare
analytics in various domains. Examples
of Hadoop application in healthcare include cancer treatments and genomics,
monitoring patient vitals, hospital network, healthcare intelligence, fraud
prevention and detection (Dezyre, 2016).
For a healthcare
organization to embrace Big Data and Big Data Analytics successfully, the
organization must embrace the building blocks of the Big Data into the building
blocks of the healthcare system. The
organization should also integrate both building blocks into the Big Data
Business Plan.
As indicated in
(Verhaeghe, n.d.), there are
four major building blocks for Big Data Analytics. The first building block is Big Data
Management to enable organization capture, store and protect the data. The
second building block for the Big Data is the Big Data Analytics to extract
value from the data. Big Data
Integration is the third building block to ensure the application of governance
over the data. The last building block
in Big Data is the Big Data Applications for the organization to apply the first three building blocks using the Big
Data technologies.
The
healthcare data must be stored in a data
store before processing the data for analytical purposes. The traditional relational database was found
inadequate to store the various types of data such as unstructured and
semi-structured dataset. Thus, new types
of databases called NoSQL as a solution to the challenges faced by the
relational database.
The
organization must choose the appropriate databases to store the medical records
of the patients in a safe way not only to
ensure compliance with the current regulations and rules such as HIPAA but also
to ensure the protection against the data leak. Various recent platforms
supporting Big Data management focus on data storage, management, processing,
and distribution and data analytics.
NoSQL stands for “Not Only SQL” (EMC, 2015; Sahafizadeh & Nematbakhsh, 2015). NoSQL is used
for modern, scalable databases in the age
of Big Data. The scalability feature
enables the systems to increase the throughput when the demand increases during
the processing of the data (Sahafizadeh & Nematbakhsh, 2015). The platform can incorporate two types of
scalability to support the processing of Big Data; horizontal scaling and vertical scaling. The horizontal scaling allows
distributing the workload across many servers and nodes. Servers can be added to the horizontal scaling to increase the
throughput (Sahafizadeh & Nematbakhsh, 2015). The vertical scaling, on the other hands,
more processors, more memories, and
faster hardware can be installed on a
single server (Sahafizadeh & Nematbakhsh, 2015). NoSQL offers benefits such as mass storage
support, reading and writing operations are fast, the expansion is easy, and the cost is low (Sahafizadeh & Nematbakhsh, 2015). Examples of the NoSQL databases are MongoDB,
CouchDB, Redis, Voldemort, Cassandra, Big Table, Riak, HBase, Hypertable,
ZooKeeper, Vertica, Neo4j, db4o, and
DynamoDB. BDA utilizes
these various types of databases which can be scaled and distributed. The data stores are categorized
into four types of store:
document-oriented, column-oriented or column family stores, graph
database, and key-value (EMC, 2015; Hashem et al., 2015).
The purpose
of the document-oriented database is to store and retrieve collections of information
and documents. Moreover, it supports complex
data forms in various format such as XML, JSON, in addition to the binary forms
such as PDF and MS Word (EMC, 2015; Hashem et al., 2015). The document-oriented database is similar to
a tuple or in the relational database. However, the document-oriented database
is more flexible and can retrieve documents and information based on their
contents. The document-oriented data
store offers additional features such as
the creation of indexes to increase the search performance of the document (EMC, 2015). The document-oriented data stores can be used for the management of the content of
web pages, as well as web analytics of log data (EMC, 2015). Example of the
document-oriented data stores includes
MongoDB, SimpleDB, and CouchDB (Hashem et al., 2015).
The
purpose of the column-oriented database is to store the content in columns
aside from rows, with attribute values belonging to the same column stored
contiguously (Hashem et al., 2015). The column family database is used to store and render blog entries, tags,
and viewers’ feedback. It is also used to store and update various web page
metrics and counters (EMC, 2015). Example of the column-oriented database is BigTable. In (EMC, 2015; Erl, Khattak, & Buhler, 2016) Cassandra is also listed
as a column-family data store.
The
key-value data store is designed to store and access data with the ability to
scale to an immense size (Hashem et al., 2015). The key-value data store contains value and
a key to access that value. The values
can be complicated (EMC, 2015). The key-value data store can be useful in
using login ID as the key to the
preference value of customers. It is
also useful in web session ID as the key with the value for the session. Examples of key-value databases include
DynamoDB, HBase, Cassandra, and Voldemort (Hashem et al., 2015). While HBase and Cassandra are described to be
the most popular and scalable key-value store (Borkar, Carey, & Li, 2012), DynamoDB and Cassandra
are described to be the two common AP (Availability and Partitioning tolerance)
systems (Chen, Mao, & Liu, 2014). Others like (Kaoudi & Manolescu, 2015) describes Apache Accumulo,
DynamoDB, and HBase as the popular key-value stores.
The
purpose of the graph database is to store and represent data which uses a graph
model with nodes, edges, and properties related to one another through
relations. Example of the graph database
is Neo4j (Hashem et al., 2015). Table 1 provides examples of NoSQL Data
Stores.
Various
research studies discussed and analyzed these data stores when using BDA in
healthcare. Some researchers such as (Klein et al., 2015) have struggled
to find the absolute answer on the proper data store in healthcare. In this project of (Klein et al., 2015), the researchers performed application-specific
prototyping and measurement to identify NoSQL products which can fit a data
model and can query use cases to meet the performance requirements of the
provider. The provider has been using thick client system running at
each site around the globe and connected to a centralized relational
database. The provider has no experience
with NoSQL. The purpose of the project
was to evaluate NoSQL databases which will meet their needs. The provider was a large healthcare provider
requesting a new Electronic Health Records (EHRs) system which supports
healthcare delivery for over nine million patients in more than 100 facilities
across the world. The rate of the data
growth is more than one terabyte per month. The data must be retained for ninety-nine years. The technology of NoSQL was considered for two major reasons. The first reason involved a Primary Data
Store for the EHRs system. The second
reason is to improve request latency and availability by using a local cache at
each site. This EHRs system required
robust and strong replica consistency. A
comparison was performed between the
identified data stores for the strong replica consistency vs. the eventual
consistency among Cassandra, MongoDB, and
Riak. The results of the project indicated that Cassandra data
store demonstrated the best throughput performance, but with the highest
latency for the specific workloads and configurations tested. The researchers analyzed such results of
Cassandra that Cassandra provides hash-based sharding spread the request and
storage load better than MongoDB. The
second reason is that indexing feature of Cassandra allowed efficient retrieval
of the most recently written records, compared to Riak. The third reason is that the P2P architecture
and data center aware feature of Cassandra
provide efficient coordination of both reads
and write operations across the replicas nodes and the data centers. The results also showed that MongoDB and
Cassandra provided a more efficient
result with respect to the performance than
Riak data store. Moreover, they provided
strong replica consistency required for such application of the data
models. The researchers concluded that
MongoDB exhibited more transparent data modeling
mapping than Cassandra, besides the indexing capabilities of MongoDB, were found to be a better fit for such
application. Moreover, the results also
showed that the throughput varied by a factor of ten, read operation latency
varied by a factor of five, and write latency by a factor of four with the
highest throughput product delivering the highest latency. The results also
showed that the throughput for workloads using strong consistency was 10-25%
lower than workloads using eventual consistency.
The
quick responses to accuracy in healthcare
are regarded to be one of the challenges
discussed earlier. The use case focused
on the performance analysis of these three selected data stores (Cassandra,
MongoDB, and Riak) since it was a
requirement from the provider, and also a challenging aspect of BDA in healthcare. This use case has demonstrated that there is
no single answer to the use of data store in BDA in healthcare. It depends on the requirements of the
healthcare organizations and the priorities.
With respect to the performance, these research studies shed light on the
performance of Cassandra, MongoDB, and
Riak when dealing with BDA in healthcare.
The
organization must follow the lifecycle of the Big Data Analytics. The life
cycle of the data analytics defines the analytics process for the
organization’s data science project.
This analytics process involves six phases of the data analytics lifecycle
identified by (EMC, 2015). These six phases involve “Discovery,” “Data
Preparation,” “Model Planning,” “Model Building,” “Communicate Results,” and “Operationalize” (EMC, 2015).
The
“Discovery” is the first phase of the data analytics lifecycle which determines whether there is enough information to
draft an analytic plan and share for peer review. In this first phase, the business domain
including the relevant history, the resources assessment including technology,
time, data, and people are identified. During this first phase of the “Discovery,”
the problem of the business and the initial hypotheses are identified. Moreover, the key stakeholders are also identified and interviewed to
understand their perspectives toward the identified problem. The potential data sources are identified, the aggregate data sources are captured, the raw data is reviewed, the data structures and tools
needed for the project are evaluated, and
the data infrastructure is identified and scoped such as disk storage and network capacity during this first phase.
The
“Data Preparation” is the second phase of the data analytics lifecycle.
During this second phase, the analytics sandbox and workspace are prepared, and the process of Extract,
Transform and Load (ETL), or Extract, Load and Transform (ELT), known as ETLT,
is performed. Moreover, during this
second phase, learning about the data is very important. Thus, the data access to the project data
must be clarified, gaps must be identified,
and datasets outside the organization must be
identified. The “data
conditioning” must be implemented which involves the process of cleaning the
data, normalizing the datasets, and performing a transformation on the data.
During the “Data Preparation,” the visualization and statistics are
implemented. The common tools for the
“Data Preparation” phase involve Hadoop,
Alpine Miner, OpenRefine, and Data Wrangler.
The
“Model Planning” is the third phase of the data analytics lifecycle. The purpose of this step is to capture the
key predictors and variables instead of considering every possible variable
which might impact the outcome. In this
phase, the data is explored, the
variables are selected, the relationships
between the variables are determined. The model is
identified with the aim to select the analytical techniques to implement
the goal of the project. The common
tools for the “Model Planning” phase include R, SQL Analysis Services, and
SAS/ACCESS.
The
“Model Building” is the fourth phase of the data analytics lifecycle, the
datasets are developed for testing,
training and production purpose. The
models which are identified in phase
three are implemented and executed. The
tools to run the identified models must be
identified and examined. The
common tools for this phase of “Model Building” include commercial tools such
as SAS Enterprise Miner, SPSS Modeler, Matlab, Alpine Miner, STATISTICA, and
open source tools such as R and PL/R, Octave, WEKA. Python, and SQL. In
accordance to (EMC, 2015), there are six
main advanced analytical models and methods which can be utilized to analyze
Big Data in different fields such as Finance, Medical, Manufacturing,
Marketing, and so forth. These six
analytical models are Clustering, Association Rules, Regression,
Classification, Time Series Analysis, and Text Analysis. The Cluster, Regression, and Classification models can be used in medical field. However, each model can serve the medical
field in different areas. For instance,
the Clustering model with the K-Means analytical method can be used in the medical domain for preventive
measures. The Regression Model can also
be used in the medical field to analyze the effect of specific medication or treatment on the patient, and the
probability for the patient to respond positively to specific treatment. The Classification model seems to be the
most appropriate model to diagnose illness.
The Classification model with the Decision Tree and Naïve Bayes method
can be used to diagnose patients with certain
diseases such as heart diseases, and the probability of a patient having a particular
disease.
“Communicate
Result” is the fifth phase which involves the communication of the result with
the stakeholders. The results of the
project must be determined whether they
are success or failure based on the criteria developed in the first phase of “Discovery.” The key findings must be identified in this phase, the business value must be quantified, and a narrative summary of the findings must be communicated to the
stakeholders. The “Operationalize” is
the last phase of the data analytics lifecycle. This phase involves the final report
delivery, briefing, code and technical documentation. A pilot project may be implemented in a production environment.
Big
Data Integration is the third building block to ensure the application of
governance over the data. The data
governance is critical to organizations, especially in healthcare due to several
security and privacy rules, to ensure the data is stored and located in
the right place and used correctly. Data siloes
are a persistent problem for healthcare organizations, and for those who have been curbing the integration and
application of new technologies such as Big Data Analytics or have just
recently began to recognize the value of Big Data Analytics. As cited in (Jennifer, 2016), Dr. Ibrahim,
Chief Data and Analytics Officer at Saint Francis Care suggested that the
solution to the siloed organizational environment is Data Governance, which
should be integrated into the overall
strategic roadmap.
As
indicated in McKinsey report by (Groves et al., 2016), there are six
significant steps which healthcare
organizations must implement to improve technology and governance strategies
for clinical and operational data. The
first step involves data ownership and security policies, which should be
established and implemented to ensure the appropriate access control and
security measures are configured for
those authorized clinical members such as physicians, nurses and so forth. The second step involves the “golden sources
of truth” for clinical data which should be implemented and reinforced by the
organization. This step involves the
aggregation of all relevant patient information in one central location to
improve population health management and accountable-care-organization. The third step involves the data architecture
and governance models to manage and share key clinical, operational, and
transactional data sources across the organization, thereby, breaking down the
internal silos. The fourth major step
involves a clear data model which should be implemented by the organization to
comply with all relevant standards and
knowledge architecture which provides consistency across disparate clinical
systems and external clinical data
repositories. The fifth step involves
decision bodies with joint clinical and IT representation which should be
developed by the organization. These
decision bodies are responsible for defining
and prioritizing key data needs. The IT
role will be redefined throughout this
step as an information services broker and architect, rather than an end-to-end
manager of information services. The
last step involves “informatics talent” which has clinical knowledge and
expertise, and advanced dynamic and statistical modeling capabilities, as the
traditional model where all clinical and IT roles were separate is no longer
workable in the age of Big Data Analytics.
The
healthcare organization can apply Big Data Analytics in several areas related
to healthcare and patient’s medical information. Examples of
such applications include three significant
applications of EMR Data, Sensor Data, and Healthcare Systems.
This application of Big Data in EMR
involves Clustering, Computational Phenotyping, Disease Progression Modelling,
and Image Data Analysis.
The
Clustering technique can assist in detecting similar patients or diseases. There are two types of techniques to derive
meaningful clusters because the raw healthcare data is not clean. The first technique tends to learn robust
latent representations first, followed by clustering methods. The second technique adopts probabilistic
clustering models which can deal with raw healthcare data effectively (Lee et al., 2017).
The
Computational Phenotyping has become a hot topic recently and has attracted the
attention of a large number of researchers as it can assist learn robust
representations from sparse, high-dimensional, noisy raw EMR data (Lee et al., 2017). There are various types of computational
phenotyping such as rules/algorithms, and latent factors or latent bases for medical features. The doctors regard phenotyping as rules that
define diagnostic or inclusion criteria.
The principal task of finding phenotyping
is achieved by a supervised task.
The domain experts first select some
features, then statistical methods such as logistic regression or chi-square
test are performed to identify the
significant features for developing acute kidney injury during hospital
admissions (Lee et al., 2017).
The
Disease Progression Modelling (DPM) is to utilize the computational methods to
model the progression of a specific disease. A specific disease can be detected
early with the help of DPM, and therefore, manage the disease better. For chronic diseases, the deterioration of the
patients for chronic diseases can be delayed, and
the healthcare outcome can be improved (Lee et al., 2017). The DPM involves statistical regression
methods, machine learning methods, and deep
learning methods. The statistical
regression methods for DPM can model the correlation between the pathological features of patients and the
condition indicators of the patients.
The progression of patients with
patients’ features can be accessed
through this correlation. The survival
analysis is another approach for DPM to link patients’ disease progression to
the time before a particular outcome such
as a liver transplant. Although the statistical regression methods
have shown to be efficient due to their simple models and computation, they
cannot be generalized for all medical scenarios. The machine learning for DPM includes various models from graphical models
such as Markov models, to multi-task learning methods and artificial neural
networks. As an example, the multi-state
Markov model which is proposed for predicting the progression between different
stages for abdominal aortic aneurysm patients considering the probability of
misclassification at the same time (Lee et al., 2017). The Deep Learning Methods become more widely
applicable to its robust representation
and abstraction due to its non-linear activation functions inside. For instance, a variant of Long Short-Term
Memory (LSTM) can be employed to model the progression of both diabetes cohort
and mental cohort (Lee et al., 2017).
The
Image Data Analysis can be used in
analyzing medical images such as the MRI images. Experiments show that incorporating
deformable models with deep learning algorithms can achieve better accuracy and
robustness for fully automatic segmentation of the left ventricle from cardiac
MRI datasets (Lee et al., 2017).
The Big Data
Applications for Sensor Data involves Mobile Healthcare, Environment Monitoring,
and Disease Detection. With respect to
the Sensor Data, there has been a drive and trend toward the utilization of
information and communication technology (ICT) in healthcare of more elderly population due to the shortage of
clinical workforce, called mobile healthcare or mHealth (Lee et al., 2017).
Personalized healthcare services will be
provided remotely, and diagnoses, medications, and treatments will be fine-tuned
for patients by spatiotemporal and psycho-physiological conditions using the
advanced technologies including the machine learning and high-performance
computing. The integration of chemical sensors for
detecting the presence of specific molecules
in the environment is another healthcare application for sensor data. The environmental monitoring for haze, sewage
water, and smog emission and so forth has become a significant worldwide
problem. With the currently advanced technologies, such environmental issues can be monitored. With regard to disease detection, the
biochemical-sensors deployed in the body can detect particular volatile organic
compounds (VOCs), The big potential of
such sensor devices and BDA of BOCs will revolutionize
healthcare both at home and in hospitals (Lee et al., 2017).
Some healthcare systems have been
designed and developed to serve as platforms for solving various healthcare
issues when deploying Big Data Analytics.
There is a system called HARVEST which is a healthcare system allowing
doctors to view patients’ longitudinal EMR data at the point of care. It is composed of two key parts; a front-end
for better virtualization; a distributed back-end which can process patients’
various types of EMR data and extract informative problem concepts from
patients’ free text data measuring each concept via “salience wights” (Lee et al., 2017). There is another system called miniTUBA to
assist clinical researchers in employing dynamic
Bayesian networks (DBN) for data analytics in temporal datasets. Another system called GEMINI which is
proposed by (Lee et al., 2017) to address
various healthcare problems such as phenotyping, disease progressing modeling,
treatment recommendation and so forth.
Figure 4 illustrate GEMINI system.
Figure 4. GEMINI Healthcare System (Lee et al., 2017).
These
are examples of Big Data Analytics Applications in Healthcare. Additional applications should be
investigated to fully utilize Big Data Analytics in various domains and areas
of healthcare as healthcare industry is a vibrant
field.
Security and privacy are very much co-related,
as enforcing security can ensure the protection of the private and critical
information of the patients. Security
and privacy are significant challenges in
healthcare. Various research studies and
reports have addressed the serious problem with healthcare-related significant data security and privacy. The Data Privacy concern is caused by the potential data breaches and data leak of the patients’
information. As indicated in (Fox & Vaidyanathan, 2016), the cyber thieves routinely
target the medical records. The Federal
Bureau of Investigation (FBI) issued a warning to healthcare providers to guard
their data against cyber attacks, after the incident of the Community Health
Systems Inc., which is regarded to be one of the largest U.S. hospital
operators. In this particular incident,
4.5 million patients’ personal information were
stolen by Chinese hackers. Moreover, the names and addresses of 80
million patients were stolen by hackers from Anthem, which is regarded to be
one of the largest U.S. health insurance companies. Although the details of the illnesses of
these patients and treatment were not exposed, however, this incident shows how
the healthcare industry is exposed to cyber
attacks.
There is an
increasing trend in such privacy data breach and data loss through cyber
attacks incidents. As indicated in (himss.org,
2018), medical and healthcare entities
accounted for 36.5% of the reported data breaches in 2017. In accordance
with a recent report published by HIPAA, the first three months of 2018 experienced 77 healthcare data breaches
reported to the Department of Health and Human Services’ Office for Civil
Rights (OCR). The report added that the
impact of these breaches was significant as more than one million patients and
health plan members were affected. These breaches are estimated to be almost
twice the number of individuals who were impacted by healthcare data breaches
in Q4 of 2017. Figure 5 illustrates
such increasing trend in the Healthcare Data Breaches (HIPAA,
2018).
Figure 5: Q1, 2018 Healthcare Data Breaches (HIPAA, 2018).
As reported in the same report, the healthcare industry is
unique with respect to the data breaches
because they are caused mostly by the insiders; “insiders were behind the
majority of breaches” (HIPAA,
2018).
Other reasons involve improper disposal, loss/theft, unauthorized access/disclosure
incidents, and hacking incidents. The most
significant healthcare data breaches of Q1 of 2018 involved 18
healthcare security breaches which impacted more than 10,000 individuals. The hacking/IT incidents involved more
records than any other breach cause as illustrated in Figure 6 (HIPAA,
2018).
Figure 6. Healthcare Records Exposed by Breach Cause (HIPAA, 2018).
The worst affected by the healthcare data breaches in Q1 of
2018 involved the healthcare providers. With respect to the states, California was the
worst affected state with 11 reported breaches and Massachusettes with eight security incidents.
Health Insurance
Portability and Accountability Act (HIPAA) of 1996 is U.S. legislation which provides
data privacy and security provisions for safeguarding medical information. Healthcare organizations must comply with and meet the requirements of
HIPAA. The compliance of HIPAA is
critical because the privacy and security of the patients’ information are of the most critical
aspect in healthcare domain. The goal
of the security is to meet the CIA Triad of Confidentiality, Integrity, and
Availability. In healthcare domain,
organizations must apply security measures by utilizing commercial software
such as Cloudera instead of using open source software which may be exposed to security holes (Fox & Vaidyanathan, 2016).
The Security Policy is a document
which defines the scope of security needed by the organization. It discusses the assets which require
protection and the extent to which security solutions should go to provide the
necessary protection (Stewart, Chapple, & Gibson, 2015). The Security Policy is an overview of the
security requirements of the organization.
It should identify the major functional areas of data processing and
clarifies and defines all relevant terminologies. It outlines the overall security strategy for
the organization. There are several
types of Security Policies. An
issue-specific Security Policy focuses on a specific network service,
department, function or other aspects which is distinct from the organization
as a whole. The system-specific Security Policy focuses on individual systems
or types of systems and prescribes approved hardware and software, outlines
methods for locking down a system, and even mandates firewall or other specific
security controls. Moreover, there are
three categories of Security Policies: Regulatory, Advisory, and
Informative. The Regulatory Policy is
required whenever industry or legal standards are an application to the organization.
This policy discusses the regulation which must be followed and outlines
the procedures that should be used to
elicit compliance. The Advisory Policy
discusses behaviors and activities which are acceptable and defines
consequences of violations. Most
policies are the advisory type. The Informative Policy is designed to provide
information or knowledge about a specific subject, such as company goals,
mission statements, or how the organization interacts with partners and customers. While Security Policies are broad overviews,
standards, baselines, guidelines, and procedures, include more specific, detailed
information on the actual security solution (Stewart et al., 2015).
The
security policy should contain security management concept and principles with
which the organization will comply. The
primary objectives of security are contained
within the security principles reflected in the CIA Triad of Confidentiality,
Integrity, and Availability. These three security principles are the most critical elements within the realm of
security. However, the importance of
each element in this CIA Triad is based
on the requirement and the security goals and objectives of the
organization. The security policies
must consider these security principles. Moreover, the security policy should
also contain additional security concepts such as Identification, Authentication,
Authorization, Auditing and Accountability (Stewart et al., 2015).
The
Confidentiality is the first of the security principles. Confidentiality provides a high level of
assurance that object, data or resources are
restricted from unauthorized users.
Confidentiality can be maintained
on the network and data must be protected from unauthorized access, use or
disclosure while data is in storage, in transit, and in process. Numerous attacks focus on the violation of
the Confidentiality. These attacks
include the capturing of the network traffic and stealing password files as
well as social engineering, port scanning, shoulder surfing, eavesdropping,
sniffing and so forth. The violation of
the Confidentiality security principle can result from actions from system
admin or end user or oversight in security policy or a misconfiguration of
security control. Numerous
countermeasures can be implemented to alleviate the violation of the
Confidentiality security principle to ensure Confidentiality against possible
threats. These security measures include
encryption, network traffic padding, strict access control, rigorous
authentication procedures, data classification, and extensive personnel
training.
The Integrity is the second security
principles, where objects must retain their veracity and be intentionally
modified only by the authorized users.
Integrity principle provides a high level of assurance that objects,
data, and resources are unaltered from their original protected state. The unauthorized modification should not
occur for the data in storage, transit or processing. The Integrity principle can be examined using
three methods. The first method is to prevent unauthorized users from making
any modification. The second method is
to prevent authorized users from making an unauthorized
modification such as mistakes. The third
method is to maintain the internal and external consistency of objects so that
the data is a correct and accurate reflection of the real world and any
relationship such as a child, peer, or parents is validated and verified. Numerous attacks focus on the violation of
the Integrity security principles using a virus,
logic bombs, unauthorized access, errors in coding and applications, malicious
modification, intentional replacement and system backdoors. The violation of
the Integrity can result in oversight in security
policy or a misconfiguration of security control. Numerous countermeasures can be implemented
to enforce the Integrity security principle and ensure Integrity against
possible threats. These security measures for Integrity include strict access control, rigorous authentication procedures,
intrusion detection systems, encryption, complete
hash verification, interface restrictions, function/input checks, and
extensive personnel training (Stewart et al., 2015).
The Availability is the third
security principle which grants timely
and uninterrupted access to objects. The
Availability provides a high level of assurance that the object, data, and resources are accessible to authorized
users. It includes efficient, uninterrupted access to objects and
prevention of Denial-of-Service (DoS) attacks.
The Availability principle also means that
the supported infrastructure such as communications, access control, and
network services is functional and allows authorized users to gain authorized
access. Numerous attacks on the
Availability include device failure, software errors, and environmental issues
such as flooding, power loss, and so forth.
It also includes attacks such as DoS attacks, object destruction, and
communication interruptions. The
violation of the Availability principles can occur as a result of the actions
of any user, including administrators, or of oversight
in security policy or a misconfiguration
of security control. Numerous
countermeasures can be implemented to ensure the Availability principles
against possible threats. These security
measures include designing the intermediary
delivery system properly, using access controls effectively, monitoring
performance and network traffic, using routers and firewalls to prevent DoS
attacks. Additional countermeasures for
the Availability principle include the implementation of redundancy for
critical systems and maintaining and testing backup systems. Most security policies and Business
Continuity Planning (BCP) focus on the
use of Fault Tolerance features at the various levels of the access, storage,
security aiming at eliminating the single point of failure to maintain the availability of critical systems (Stewart et al., 2015).
These three security principles drive
the Security Policies for organizations. Some organizations such as military
and government organizations tend to prioritize Confidentiality above
Integrity, while private organization tends
to prioritize Availability above Confidentiality and Integrity. However, the prioritization does not imply
that the other principles are ignored or improperly addressed (Stewart et al., 2015).
Additional
security concepts must be considered in
the Security Policy of the organization.
These security concepts are called Five Elements of AAA Services. They include identification. Authentication,
Authorization, Auditing, and Accounting.
The Identification can include
username, swiping a smart card, waving a proximity device, speaking a phrase,
or positioning hand or face or finger for a camera or scanning device. The Identification concept is fundamental as it verifies the access to the
secured building or data to only the authorized users. The Authentication requires additional
information from the users. The typical
form of Authentication is the password, PINs, or passphrase, or security
questions. If the user is authenticated, it does not mean the user is
authorized.
The
Authorization concept reflects the right
privileges which are assigned to the
authenticated user. The access control
matrix is evaluated to determine whether the user is authorized to access specific data or object. The Authorization concept is implemented
using access control such as discretionary access contr0l (DAC), mandatory
access control (MAC), or role-based access control (RBAC) (Stewart et al., 2015).
The Auditing concept or Monitoring
is the programmatic technique through which an action of a user is tracked and recorded to hold the user accountable for such action, while authenticated
on a system. The abnormal activities
are detected in a system using the
Auditing and Monitoring concept. The
Auditing and Monitoring concept is
required to detect malicious actions by users, attempted intrusions, and system
failures and to reconstruct events. It is to provide evidence for the prosecution and produce problem reports and
analysis (Stewart et al., 2015).
The Accountability concept is the
last security concept which must be addressed
in the Security Policy. The
Accountability concept is to maintain security only if users are held
accountable for their actions. The
Accountability concept is implemented by
linking a human to the activities of an online identity through the security services
and Auditing and Monitoring techniques, Authorization, Authentication, and
Identification. Thus, the Accountability
is based on the strength of the
Authentication process. Without robust
Authentication process and techniques, there will be a doubt about the
Accountability. For instance, if the
Authentication is using only a password technique, there is a significant room
for doubt because of the password, especially weak passwords. However, the password for the implementation of multi-factor authentication, smartcard,
fingerprint scan, there will be very little room for doubt (Stewart et al., 2015).
The
Security Policy must address the security access from outside to the building
and from inside within the building. Some
employees are authorized to enter one part of the building but not others. Thus, the Security Policy must identify the
techniques and methods which will be used to ensure access for those authorized
users. Based on the design of the
building discussed earlier, the employees will have the main entrance. There is
no back door as an entrance for the employees.
The badge will be used to enter the building, and also to enter the
authorized area for each employee. The
visitors will have another entrance because this is a healthcare
organization. The visitors and patients
will have to be authorized by the help desk to direct them to the right place,
such as pediatric, emergency and so forth.
Thus, there will be two main entrances, one for employees and another
for visitors and patients. All
equipment rooms must be locked all the time, and the access to these equipment
rooms must be controlled. A strict inventory of all equipment so that
any theft can be discovered. The access to the data centers and servers
rooms must have more restrictions and more security than the normal security to
equipment rooms. The data center must be
secured physically with lock systems and should not have drop ceilings. The work areas should be divided into sections based on the security access for
employees. For instance, help desk
employees will not have access to the data
center or server rooms. Works areas
should be restricted to employees based
on their security access roles and privileges.
Any access violation will require three warnings, after which a violation action will be taken against the employees which can lead to separating the
employee from the organization (Abernathy & McMillan, 2016).
Most considerations concerning
security revolve around preventing mischief.
However, the security team is responsible for preventing damage to the
data and equipment from environmental conditions because it is part of the Availability principle of the CIA Triad. The Security Plan should address fire
protection, fire detection, and fire suppression. Thus, all the measures for fire protection,
detection and suppression must be in place.
Example of the fire protection, no hazards materials should be
used. Concerning
power supply, there are common power issues such as prolonged high voltage,
power outage. The preventive measures to prevent static electricity from
damaging components should be observed.
Some of these measures include anti-static sprays, proper humidity
level, anti-static mats, and wristbands.
HVAC should be considered, not only for the comfort of the employees but
also for the computer rooms, data centers, and
server centers. The water leakage and flooding should be examined, and
security measures such as water detectors should be in place. Additional environmental alarms should be in
place to protect the building from any
environmental events that can cause damage to the data center or server center.
The organization will comply with these environmental measures (Abernathy & McMillan, 2016).
The organization must follow the
procedure concerning equipment and media and the use of safes and vaults for
protecting other valuable physical assets.
The procedures involve security measures such as tamper protection. Tampering includes
defacing, damaging, or changing the configuration of a device. The Integrity
verification measures should be used to look for evidence of data tampering,
error and omissions. Moreover, sensitive
data should be encrypted to prevent the exposure of data in the event of theft (Abernathy & McMillan, 2016).
An inventory for all should be performed, and
the relevant list should be maintained
and updated regularly. The physical
protection of security devices includes firewalls, NAT devices, and intrusion
detection and prevention systems. The
tracking devices technique can be used to track a device that has critical
information. With respect to protecting physical assets such as smartphones,
laptops, tablets, locking the devices is a proper
security technique (Abernathy & McMillan, 2016).
With respect to the Information
Security, there are seven main pillars.
Figure 7 summarizes these pillars for Information Security for the
healthcare organization.
Complete
Confidentiality.
Available Information.
Traceability.
Reliable Information.
Standardized
Information.
Follow Information
Security Laws, Rules, and Standards.
Informed Patients and Family with Permission.
Figure 7. Information Security Seven Pillars.
The
Complete Confidentiality is to ensure that only authorized people can access
sensitive information about the patients.
The Confidentiality is the first principle of the CIA Triad. The
Confidentiality of the Information
Security is related to the information handled by the computer system, manual
information handling or through communications among employees. The ultimate
goal of the Confidentiality is to protect patients’ information from
unauthorized users. The Available
Information means that healthcare professionals should have access to the
patients’ information when needed. This
security feature is very critical in health care
cases. The healthcare
organization should keep medical records, and
the systems which store these records should be trustworthy. The information should be available with no
regard to the place, person or time.
The Traceability means that actions and decision concerning the flow of
information in the Information System should be traceable through logging and
documentation. The Traceability can be ensured by logging, supervision of the networks, and use of
digital signatures. The Auditing and Monitoring concept discussed
earlier can enforce the Traceability goal.
The Reliable Information means that the information is correct. To have access to reliable information is
very important in the healthcare organization.
Thus, preventing unauthorized users from accessing the information can
enforce the reliability of the information.
The Standardized Information reflects the importance of using
the same structure and concepts when recording information. The healthcare organization should comply
with all standards and policies including HIPAA to protect patients’ information. The Informed Patients and Family is important to make sure they are aware of the health
status. The patient has to approve
before passing any medical records to any
relatives (Kolkowska, Hedström, & Karlsson, 2009).
The
Security Policy should cover protection techniques and mechanisms for security
control. These protection techniques
include multiple layers or levels of access, abstraction, hiding data, and
using encryption. The multi-level
technique is known as defense in depth providing multiple controls in a
series. This technique allows for
numerous and different controls to guard against threats. When organizations apply the multi-level
technique, most threats are mitigated, eliminated or thwarted. Thus, this multi-level technique should be applied in the healthcare organization. For instance, a single entrance is provided, which has several gateway or
checkpoints that must be passed in
sequential order to gain entry into active areas of the building. The same concept of the multi-layering can be applied to the networks. The single sign-on
technique should not be used for all employees at all levels for all
applications, especially in a healthcare
organization. Serious consideration must
be taken when implementing single sign-on
because it eliminates the multi-layer security technique (Stewart et al., 2015).
The abstraction technique is used for efficiency. Elements that are similar should be
classified and put into groups, classes, or roles with security controls, restrictions, or permissions as a
collective. Thus, the abstraction
concept is used to define the types of data an object can contain, the types of
functions to be performed. It simplifies the security by assigning security
controls to a group of objects collected by type or functions (Stewart et al., 2015).
The data hiding is another
protection technique to prevent data from being discovered or accessed by
unauthorized users. Data hiding
protection technique include keeping a database from being accessed by
unauthorized users and restricting users to a lower classification level from
accessing data at a higher classification level. Another form of the data hiding technique includes preventing the application from accessing hardware directly. The data hiding is a critical element in a security
control and programming (Stewart et al., 2015).
The encryption is another protection
technique which is used to hide the meaning or intent of communication from unintended recipients. Encryption can take many forms and can be applied to every type of electronic communications such as text, audio, video
files, and applications. Encryption is an essential element in security control, especially for the data
in transit. Encryption has various types
and strength. Each type of the
encryption is used for specific
purpose. Examples of these encryption
types include PKI and Cryptographic
Application, and Cryptography and Symmetric Key Algorithm (Stewart et al., 2015).
Organizations and
businesses are confronted with disasters whether the disaster is caused by nature such as hurricane or
earthquake or human-made calamities such as fire or burst water pipes.
Thus, organizations and business
must be prepared for such disasters to
recover and ensure the business continuity in the middle of these sudden
damages. The critical importance of
planning for business continuity and disaster recovery has to lead the International Information System Security Certification
Consortium (ISC) included the two process of Business Continuity and Disaster
Recovery in the Common Body of Knowledge
for the CISSP program (Abernathy & McMillan, 2016; Stewart et al., 2015).
The Business Continuity Planning (BCP) involves the assessment of the risk to the organizational processes and the development of policies, plans, and process to minimize the impact of those risks if it occurs. Organizations must implement BCP to maintain the continuous operation of the business if any disaster occurs. The BCP emphasize on the keeping and maintaining the business operations with the reduction or restricted infrastructure capabilities or resources. The BCP can be used to manage and restore the environment. If the continuity of the business is broken, then the business processes have seized, and the organization is in the disaster mode, which should follow the Disaster Recovery Planning (DRP). The top priority of the BCP and DRP is always people. The main concern is to get people out of the harm; and the organization can address the IT recovery and restorations issues (Abernathy & McMillan, 2016; Stewart et al., 2015).
As
indicated in (Abernathy & McMillan, 2016), the steps of
the Special Publications (SP) 800-34 Revision 1 (R1) from the NIST include
seven steps. The first step involves the
development of the contingency planning policy. The second step involves the
implementation of the Business Impact Analysis.
The Preventive Controls should be identified representing the third
step. The development of Recovery
Strategies is the fourth step. The fifth step involves the development of the
BCP. The six-step
involves the testing, training, and
exercise. The last step is to maintain the plan. Figure 8 summarizes these
seven steps identified by the NIST.
Figure 8. Summary of the Business Continuity Steps (Abernathy & McMillan, 2016).
In case of the disaster event occur, the organization must have in place a strategy and plan to recover from such a disaster. Organizations and businesses are exposed to various types of disasters. However, these types of disaster are categorized to be either disaster caused by nature or disaster caused by a human. The disasters which are nature related include the earthquakes, floods, storms, hurricanes, volcanos, and fires. The human-made disasters include fires caused intentionally, acts of terrorism, explosions, and power outages. Other disasters can be caused by hardware and software failures, strikes and picketing, theft and vandalism. Thus, the organization must be prepared and ready to recover from any disaster. Moreover, the organization must document the Disaster Recovery Plan and provide training to the personnel (Stewart et al., 2015).
The security CIA Triad involves
Confidentiality, Integrity, and Availability.
Thus, the fault tolerance and system resilience affect directly one of
the security CIA Triad of the Availability.
The underlying concept behind the fault tolerance and the system
resilience is to eliminate single points of failure. The single point of failure represents any
component which can cause the entire system to fail. For instance, if a computer had data on a
single disk, the failure of the disk can cause the computer to fail, so the disk is a single point of failure. Another example involves the database when a
single database serves multiple web servers; the
database becomes a single point of failure (Stewart et al., 2015).
The fault tolerance reflects the
ability of the system to suffer a fault but continue to operate. The fault tolerance is implemented by adding redundant components such as additional
disks within a redundant array of independent disks (RAID), sometimes it is
called inexpensive disks, or additional servers within a failover clustered
configuration. The system resilience
reflects the ability of the system to maintain the acceptable level of service
during an adverse event, and be able to return to the previous state. For instance, if a primary server in a
failover cluster fails, the fault tolerance can ensure the failover to another
system. The system resilience indicates
that the cluster can fail back to the original server after the original server
is repaired (Stewart et al., 2015).
The organization must have a plan
and strategy to protect the hard drives from single points of failure to
provide fault tolerance and system resilience.
The typical technique is to add a redundant array of disks of the RAID array.
The RAID array includes two or
more disks, and most RAID configurations
will continue to operate even after one of the disks fails. There are various
types of arrays. The organization must
utilize the proper RAID for the fault tolerance and system resilience. Figure 9 summarizes some of the standard RAID configurations.
Figure 9. A Summary of the Common RAID Configurations.
The fault tolerance can be
considered and added to critical servers
with failover clusters. The failover
cluster includes two or more servers or nodes, if one server fails, the other
server in the cluster can take over its load automatically using the “failover”
process. The failover clusters can also
provide fault tolerance for multiple devices or applications. The typical
topology to consider fault tolerance include multiple web servers with network
load balancing, and multiple database servers at the backend with a load
balancer as well, and RAID arrays for redundancy. Figure 10 illustrates a simple failover
cluster with network load balancing, adapted from (Stewart et al., 2015).
Figure 10. Failover Cluster with Network Load Balancing (Stewart et al., 2015).
The organization must also consider
the power sources with “uninterruptible
power supply” (UPS), a generator, or both to ensure fault tolerance
environment. The UPS provides
battery-supplied power for a short period
between 5 and 30 minutes, while the generator provides long-term power. The goal of using UPS is to provide power
long enough to complete a logical shutdown of a system, or until a generator is
powered on to provide stable power.
The organization must
ensure that the recovered environment is secure to protect against any malicious attacks. Thus, the system administrator with the security professional
must ensure that the system can be trusted by
the users. The system can be
designed to fail in a fail-secure state or a fail-open state. The fail-secure
system will default to a secure state in the event of a failure, blocking all
access. The fail-open system will fail in an open state, granting all access to
all users. In a critical healthcare
environment, the fail-secure system should be the default configuration in case
of failure, and the security professional can set the access after the failure
using an automated process to set up the
access control as identified in the security plan (Stewart et al., 2015).
The control of Quality of Service
(QoS) provides protection and integrity of the data network under load. The QoS attempts to manage factors such as
bandwidth, latency, the variation in latency between packets, known as
“Jitter,” packet loss, and interference. The QoS systems often prioritize certain
traffic types which have a low tolerance
for interference and have high business requirements (Stewart et al., 2015).
The organization must implement a
disaster recovery plan which covers the details of the recovery process of the
system and environment in case of failure.
The disaster recovery plan should be designed to allow the recovery even
in the absence of the DRP team, by allowing people in the scene to begin the
recovery effort until the DRP team
arrives.
The organization must engineer and
develop the DBP to allow the business unit and operation with the highest
priority are recovered first. Thus, the priority of the business operations
and the unit must be identified in the DRP.
All critical business operations must be placed with the top priority
and be considered to be recovered
first. The organization must consider
the panic associated with disaster in the DRP.
The personnel of the organization must be trained to be able to handle
the disaster recovery process properly and reduce the panic associated with
it. Moreover, the organization must
establish internal and external communications in case of the disaster recovery
to allow people to communicate during the recovery process (Stewart et al., 2015).
The DRP should address in detail the
backup strategy and plan. There are
three types of backups; Full Backup, Incremental Backup, and Differential Backup. The Full Backup store a complete copy of the
data contained on the protected devices.
It duplicates every file on the system.
The Incremental Backup stores only those files which have been modified since the time of the most recent
full or incremental backup. The Differential Backup store all files which
have been modified since the time of the
most recent full backup. It is very
critical for the healthcare organization to employ more than one type of
backup. The Full Backup over the weekend
and incremental or differential backups on a nightly basis should be implemented as part of the DRP (Stewart et al., 2015).
Various research studies such as (cleardata.com,
2015; Ranajee, 2012) have discussed the best practice for Business
Continuity (BC) and Disaster Recovery (DR) (BC/DR) in healthcare. As addressed in (cleardata.com,
2015), the best practice involves Cloud Computing as the technology
to use for BC and DR rather than handling them in-house. Some of the primary
reasons for taking BD/DR to the Cloud involve the easier compliance of HIPAA
and HITECH, better objectives for recovery such as recovery time objective
(RTO), and recovery point objective (RPO), moving the expenditure from capital expenditure
to operational expenditure, fast deployment, and
enhanced scalability.
The best practice for BC/DR for healthcare
organizations using the Cloud involves five significant
steps. The first step involves the
health-check of the existing BC/DR environment.
This step involves the risk assessment check, IT performance check,
Backup Integrity Check, and Restore Capabilities Check. The second step involves the Impact Analysis
which define the costs, benefits, and risks associated with moving aspects of
the BC/DR to the cloud. The impact
analysis should cover the financial and the allocated budget, personnel,
technology, business process, security, compliance, patient care, innovation, and growth.
The third step in the best practice for BC/DR is to outline the solution
requirements such as the RTO and RPO, regulatory requirements, resources
requirements, the use of BYOD, the ability to share the patient’s data within the same network, and with service providers.
The next step for healthcare organizations to map the requirements to the
available deployment models, such as cloud backup-as-a-service (BUaaS), Cloud
Replication, Cloud Infrastructure-as-a-Service (IaaS). The last step involves the criteria
identification for the demonstration of experience in the healthcare industry including HIPAA compliance,
RTO and RPO to meet the risk assessment guidelines, and the proof-of-concept
delivery to test the BC/DR.
Abernathy, R., &
McMillan, T. (2016). CISSP Cert Guide:
Pearson IT Certification.
Alexandru,
A., Alexandru, C., Coardos, D., & Tudora, E. (2016). Healthcare, Big Data
and Cloud Computing. management, 1,
2.
Aljumah,
A. A., Ahamad, M. G., & Siddiqui, M. K. (2013). Application of data mining:
Diabetes health care in young and old patients. Journal of King Saud University-Computer and Information Sciences, 25(2),
127-136.
Archenaa,
J., & Anita, E. M. (2015). A survey of big data analytics in healthcare and
government. Procedia Computer Science, 50,
408-413.
Borkar,
V. R., Carey, M. J., & Li, C. (2012). Big data platforms: what’s next? XRDS: Crossroads, The ACM Magazine for
Students, 19(1), 44-49.
Chawla,
N. V., & Davis, D. A. (2013). Bringing big data to personalized healthcare:
a patient-centered framework. Journal of
general internal medicine, 28(3), 660-665.
Chen,
M., Mao, S., & Liu, Y. (2014). Big data: a survey. Mobile Networks and Applications, 19(2), 171-209.
EMC.
(2015). Data Science and Big Data
Analytics: Discovering, Analyzing, Visualizing and Presenting Data. (1st
ed.): Wiley.
Erl,
T., Khattak, W., & Buhler, P. (2016). Big
Data Fundamentals: Concepts, Drivers & Techniques: Prentice Hall Press.
Eswari,
T., Sampath, P., & Lavanya, S. (2015). Predictive methodology for diabetic
data analysis in big data. Procedia
Computer Science, 50, 203-208.
Fox,
M., & Vaidyanathan, G. (2016). IMPACTS OF HEALTHCARE BIG DATA: A FRAMEWORK
WITH LEGAL AND ETHICAL INSIGHTS. Issues
in Information Systems, 17(3).
Groves,
P., Kayyali, B., Knott, D., & Kuiken, S. V. (2016). The ‘Big Data’
Revolution in Healthcare: Accelerating Value and Innovation.
Hashem,
I. A. T., Yaqoob, I., Anuar, N. B., Mokhtar, S., Gani, A., & Khan, S. U.
(2015). The rise of “big data” on cloud computing: Review and open research
issues. Information Systems, 47,
98-115.
Jee,
K., & Kim, G.-H. (2013). Potentiality of big data in the medical sector:
focus on how to reshape the healthcare system. Healthcare informatics research, 19(2), 79-85.
Joudaki,
H., Rashidian, A., Minaei-Bidgoli, B., Mahmoodi, M., Geraili, B., Nasiri, M.,
& Arab, M. (2015). Using data mining to detect health care fraud and abuse:
a review of the literature. Global
journal of health science, 7(1), 194.
Kaoudi,
Z., & Manolescu, I. (2015). RDF in the clouds: a survey. The VLDB Journal, 24(1), 67-91.
Klein,
J., Gorton, I., Ernst, N., Donohoe, P., Pham, K., & Matser, C. (2015, June
27 2015-July 2 2015). Application-Specific
Evaluation of No SQL Databases. Paper presented at the 2015 IEEE
International Congress on Big Data.
Kolkowska,
E., Hedström, K., & Karlsson, F. (2009). Information security goals in a Swedish hospital. Paper presented
at the 8th Annual Security Conference, 15-16 April 2009, Las Vegas, USA.
Landolina,
M., Perego, G. B., Lunati, M., Curnis, A., Guenzati, G., Vicentini, A., . . .
Valsecchi, S. (2012). Remote Monitoring Reduces Healthcare Use and Improves
Quality of Care in Heart Failure Patients With Implantable
DefibrillatorsClinical Perspective: The Evolution of Management Strategies of
Heart Failure Patients With Implantable Defibrillators (EVOLVO) Study. Circulation, 125(24), 2985-2992.
Lee,
C., Luo, Z., Ngiam, K. Y., Zhang, M., Zheng, K., Chen, G., . . . Yip, W. L. J.
(2017). Big healthcare data analytics: Challenges and applications Handbook of Large-Scale Distributed
Computing in Smart Healthcare (pp. 11-41): Springer.
Liang,
Y., & Kelemen, A. (2016). Big Data Science and its Applications in Health
and Medical Research: Challenges and Opportunities. Austin Journal of Biometrics & Biostatistics, 7(3).
Ohlhorst,
F. J. (2012). Big data analytics: turning
big data into big money: John Wiley & Sons.
Raghupathi,
W., & Raghupathi, V. (2014). Big data analytics in healthcare: promise and
potential. Health Information Science and
Systems, 2(1), 1.
Ranajee,
N. (2012). Best practices in healthcare disaster recovery planning: The push to
adopt EHRs is creating new data management challenges for healthcare IT
executives. Health management technology,
33(5), 22-24.
Rawte,
V., & Anuradha, G. (2015). Fraud
detection in health insurance using data mining techniques. Paper presented
at the Communication, Information & Computing Technology (ICCICT), 2015
International Conference on.
Sahafizadeh,
E., & Nematbakhsh, M. A. (2015). A Survey on Security Issues in Big Data
and NoSQL. Int’l J. Advances in Computer
Science, 4(4), 2322-5157.
Wang,
Y., Kung, L., & Byrd, T. A. (2018). Big data analytics: Understanding its
capabilities and potential benefits for healthcare organizations. Technological Forecasting and Social Change,
126, 3-13.
Ward,
M. J., Marsolo, K. A., & Froehle, C. M. (2014). Applications of business
analytics in healthcare. Business Horizons,
57(5), 571-582.
The purpose of this discussion is to discuss and analyze a case study which demonstrates the need for data-in-motion analytics. The discussion begins with real-time data and data-in motion followed by the need for data-in-motion analytics.
Real-Time Data and Data-in-Motion
There are three types of status for data: data in use, data at rest and data in motion. The data in use indicates that the data are used for services or users require them for their work to accomplish specific tasks. The data at rest indicates that the data are not in use and are stored or archived in storage. The data in motion indicates that the data state is about to change from data at rest to data in use or transferred from one place to another successfully (Chang, Kuo, & Ramachandran, 2016).
One of the significant characteristics of Big Data is velocity. The speed of data generation is described by (Abbasi, Sarker, &
Chiang, 2016)
as “hallmark” of Big Data. Wal-Mart is
an example of generating the explosive
amount of data, by collecting over 2.5 petabytes of customer transaction data
every hour. Moreover, over one billion
new tweets occur every three days, and five billion search queries occur daily (Abbasi et al., 2016). Velocity is the
data in motion (Chopra & Madan, 2015;
Emani, Cullot, & Nicolle, 2015; Katal, Wazid, & Goudar, 2013; Moorthy,
Baby, & Senthamaraiselvi, 2014; Nasser & Tariq, 2015). Velocity involves streams of data, structured
data, and the availability of access and
delivery (Emani et al., 2015). The velocity of the incoming data does not only represent
the challenge of the speed of the incoming data because this data can be
processed using the batch processing but
also in streaming such high speed-generated data during the real-time for
knowledge-based decision (Emani et al., 2015; Nasser
& Tariq, 2015). Real-Time Data (a.k.a Data in Motion) is the
streaming data which needs to be analyzed as it comes
in (Jain, 2013).
As indicated in (CSA, 2013), the technologies of Big Data are divided into two categories; batch processing for analyzing
data that is at rest, and stream processing for analyzing data in motion. Example
of data at rest analysis includes sales analysis, which is not based on a real-time data processing (Jain, 2013). Example of data in
motion analysis includes Association
Rules in e-commerce. The response time for
each data processing category is different.
For the stream processing, the response time of data was from
millisecond to seconds, but the more significant
challenge is to stream data and reduce the response time under much lower than
milliseconds, which is very challenging (Chopra & Madan, 2015;
CSA, 2013).
The data in motion reflecting the stream processing or real-time processing
does not always need to reside in memory, and new interactive analysis of
large-scale data sets through new technologies like Apache Drill and Google’s
Dremel provide new paradigms for data analytics. Figure 1 illustrates the response time for
each processing type.
Figure 1. The Batch and Stream Processing Responsiveness (CSA, 2013).
There are two kinds of systems for
the data at rest; the NoSQL systems for interactive data serving environments,
and the systems for large-scale analytics
based on MapReduce paradigm, such as Hadoop.
The NoSQL systems are designed to have a simpler key-value based Data
Model having in-built sharding, and work seamlessly in a distributed cloud-based environment (Gupta, Gupta, & Mohania,
2012). The data stream management system allows the user to analyze data in motion, rather than
collecting vast quantities of data,
storing it on disk, and then analyzing it.
There are various streams processing systems such as IBM
InfoSphere Streams (Gupta et al., 2012; Hirzel
et al., 2013),
Twitter’s Storm, and Yahoo’s S4. These
systems are designed and geared towards clusters of commodity hardware for
real-time data processing (Gupta et al., 2012).
The Need for Data In-Motion Analytics
The explosive growth of data provides significant implications for “real-time” predictive analytics in various application areas, ranging from health to finance (Abbasi et al., 2016). The analysis of data in motion presents new challenges as the desired patterns and insights are moving targets which are different when dealing with static data (Abbasi et al., 2016). Adding streaming analytics processes might be required because of the increased velocity of the data, to focus on the evaluation of the precision, accuracy, and integrity of the data while the data is in motion. Moreover, the availability window is decreased because of the high velocity of the systems as well.
However, the traditional batch
processing cycle times can expose the business to high risk, and any delay
protracts the exposure in cases such as the fraud or public safety threats (Ballard et al., 2014), or intrusion detection.
As indicated in (Sokol & Ames, 2012), the frameworks of streaming analytics enable organizations
to apply various continuous and predictive analytics to structured and
unstructured data in motion. These
streaming analytics frameworks bring high-value
information in real-time or near real-time rather than waiting to store and
perform traditional business intelligence operations which might be too late to
affect situational awareness. Thus,
there is a need for real-time data analytics or data analytics in motion.
Case Study
The value of Big Data in various industries is demonstrated in various case studies. In (Przybyszewski, 2016), the value of Big Data Analytics in real time is demonstrated across various industries such as banking, finance, communications, public sector, retail and CPG, manufacturing and healthcare life science. Figure 2 illustrates the value of Big Data Analytics in real-time (a.k.a in motion).
Figure 2. The Value of Data Analytics in Real-Time (Przybyszewski, 2016).
The use case involves a major specialty department store.
The business challenge faced by a major
specialty department store was to improve its product marketing precision. The company was interested in enabling
in-store, real-time production promotion among its shoppers. The solution was to use Big Data Analytics in
real-time. The company ingested and
integrated data in real-time and batch, in both structured and unstructured
formats. An ETL process transforms the raw data, which was then
consumed by learning algorithms. The
retailer can now deliver real-time recommendations and promotions through all channels, including its website,
store kiosks, and mobile apps. The use
of the Big Data Analytics in real-time resulted in building omnichannel recommendation engine similar to
what Amazon does online. Thirty-five percent of what consumers
purchase on Amazon and seventy-five
percent of what they watch on Netflix comes from such product recommendations
based on that type of analysis. The
retailed benefitted from the recommendations engine by providing recommendations
based on weather, loyalty, purchase history, abandoned carts or life stage
triggers, and deliver those to the shopper
in its stores (Przybyszewski, 2016).
Another example is in the healthcare industry. Big Data is making significant impacts
throughout many industries such as healthcare leading cancer patients to full
recovery, increasing the reach of disaster relief efforts, and much more (Capella.edu, 2017). As indicated in (InformationBuilders, 2018), the providers
can be granted real-time, single-view
access to the patient, clinical and other
relevant health
data to support improved decision-making and facilitated effective, efficient
and error-free care. They can also
ensure accurate, on-time payment which promptly reimburses them for their time
and care (InformationBuilders, 2018). Moreover, as indicated in (White-House, 2014), the Centers for
Medicare and Medicaid Services have begun using predictive analytics software
to likely flag instances of reimbursement
fraud before claims are paid. The Fraud
Prevention System helps identify the highest risk healthcare providers for
fraud, waste, and abuse in real-time, and has already stopped, prevented or
identified $115 in fraudulent payments saving $3 for every $1 spent in the
program’s first year (White-House, 2014).
In summary, Big Data Analytics in real-time adds much
value to the organization, besides the
batch processing technique which is based
on processing data at rest. The
analytics is based on streaming real-time
data which is transformed into knowledge
for better decisions instantaneously. The data in motion analytics is being implemented
successfully across various industries including healthcare, retail, banking
and more.
References
Abbasi, A., Sarker, S., &
Chiang, R. (2016). Big data research in information systems: Toward an
inclusive research agenda. Journal of the
Association for Information Systems, 17(2), 3.
Ballard, C.,
Compert, C., Jesionowski, T., Milman, I., Plants, B., Rosen, B., & Smith,
H. (2014). Information governance
principles and practices for a big data landscape: IBM Redbooks.
Chang, V., Kuo,
Y.-H., & Ramachandran, M. (2016). Cloud computing adoption framework: A
security framework for business clouds. Future
Generation computer systems, 57, 24-41. doi:http://dx.doi.org/10.1016/j.future.2015.09.031
Chopra, A., &
Madan, S. (2015). Big Data: A Trouble or A Real Solution? International Journal of Computer Science Issues (IJCSI), 12(2),
221.
CSA, C. S. A.
(2013). Big Data Analytics for Security Intelligence. Big Data Working Group.
Emani, C. K.,
Cullot, N., & Nicolle, C. (2015). Understandable big data: A survey. Computer science review, 17, 70-81.
Gupta, R., Gupta,
H., & Mohania, M. (2012). Cloud
computing and big data analytics: what is new from databases perspective?
Paper presented at the International Conference on Big Data Analytics.
Hirzel, M.,
Andrade, H., Gedik, B., Jacques-Silva, G., Khandekar, R., Kumar, V., . . .
Soulé, R. (2013). IBM streams processing language: Analyzing big data in
motion. IBM Journal of Research and
Development, 57(3/4), 7: 1-7: 11.
Katal, A., Wazid,
M., & Goudar, R. (2013). Big data:
issues, challenges, tools and good practices. Paper presented at the
Contemporary Computing (IC3), 2013 Sixth International Conference on
Contemporary Computing.
Moorthy, M.,
Baby, R., & Senthamaraiselvi, S. (2014). An Analysis for Big Data and its
Technologies. International Journal of
Science, Engineering and Computer Technology, 4(12), 412.
Nasser, T., &
Tariq, R. (2015). Big Data Challenges. J
Comput Eng Inf Technol 4: 3. doi:10.4172/2324, 9307, 2.
The purpose of this discussion is to present a case study on the impact of the international laws on Big Data Analytics in Healthcare Industry. The discussion begins with the security program development frameworks and current regulatory landscape, followed by the impact and the use case example.
Security Program Development Frameworks and Current Regulatory Landscape
Various frameworks and methodologies are developed to guide the security professional for security implementation and privacy protection. These frameworks include security program development standards, enterprise and security architect development frameworks, security controls development methods, corporate governance methods, and process management methods. These frameworks include International Organization for Standardization (ISO), which is often incorrectly referred to as International Standards Organizations. This organization joined with the International Electrotechnical Commission (IEC) to standardize the British Standards 7799 (BS7799) to a new global standard which is not referred to as ISO/IEC 27000 Series. The ISO 27000 is a security program development standard on the methods and approaches to develop and maintain information security management system (ISMS) (Abernathy & McMillan, 2016; Stewart, Chapple, & Gibson, 2015).
Organizations must comply with standards, guidelines, regulations and
legislation, and governmental laws.
Moreover, the security professional must have a good understanding of
the security and privacy standards, guidelines, regulations, and laws.
Organizations must consider local,
regional, state, federal and international governments and bodies. These
regulations and standards are usually industry specific. For instance, in the healthcare industry, the Health Insurance Portability and
Accountability Act (HIPAA) is the framework which healthcare industry must
follow and comply with. Thus, healthcare organization must follow
regulations regarding the collection, the use, the storage and the protection
of the personally identified information (PII) (Abernathy & McMillan, 2016). Moreover, the
security professionals must ensure that they have a good understanding of the
international, national, state and local regulations and laws regarding the
personally identifiable information (PII).
The PII is defined as any piece of data that can be used alone or with
other information to identify a single person (Abernathy & McMillan, 2016; Stewart et al., 2015).
Various regulatory entities and industry standards have demonstrated that
they will hold organizations responsible and accountable for their actions as
“the risk of consumer injury increases as the volume and sensitivity of data grows” (Bell, Rotman, & VanDenBerg, 2014). As indicated in (Bell et al., 2014), Federal Trade Commission (FTC) Chairwoman Edith
Ramirez addressed Big Data from the regulator perspective as “… The challenges
it [Big Data] poses to consumer privacy are familiar, even though they may be
of a magnitude we have yet to see. The solutions are also familiar.
And, with the advent of Big Data,
they are now more important than ever.”
Big Data is generally dominated by “sectoral privacy laws” similar to U.S.
privacy regulations. The U.S does not
have a national privacy law, or laws specific to Big Data. However, existing
laws are restricting the collection, use, and storage of specific personal
information types including information related to health, financial, and children. These laws in some cases have been updated to
respond to collection practices made possible by new technology, namely
data-gathering tools such as social media and mobile applications (Bell et al., 2014).
Organizations must evaluate previously passed Big Data-related regulations
to address high-risk or sensitive Big Data impact areas. For instance, the
provision in the Fair Credit Reporting Act (FCRA) which requires that
individuals be notified of adverse decisions made using databases,
highlight the fact that negative
decisions carry higher risks than
positive ones. The Children’s Online
Privacy Protection Act (COPPA) requires parental consent before the collection of the information of
minors. Section 5 of the FTC Act
requires the FTC to prosecute unfair or deceptive acts or practices which may affect interstate commerce and to prevent “unfair” commercial
practices, but these are not narrowly defined in Big Data context (Bell et al., 2014).
International Laws Impact on Big Data Analytics in Healthcare
Big Data and Big Data Analytics provide significant benefits to the healthcare industry in various domains from providing quality care to fraud detection, to lower cost. Healthcare organization are rapidly implementing Big Data programs to strategically change their business modes to gain a competitive advantage, increase their bottom line, and expand their global presence. However, these Big Data programs face potential conflict with an increasing number of international laws and standards as they grow. Thus, organizations must seek the appropriate balance of opportunities and challenges as they develop the Big Data governance programs to optimize the benefits of Big Data, while adequately addressing issues related to global privacy, security, and compliance (Bell et al., 2014).
There are five significant Big Data
Security and Privacy challenges which healthcare organizations must address to
assist in enduring proper control of their Big Data programs. The first key challenge is the Big Data
Governance. The implementation of Big
Data can lead to a discovery of previously secret
or sensitive information through the combination of different datasets.
The healthcare organization adopting Big Data initiative without a robust governance
policy in place, take a risk and place
themselves in an ethical dilemma because
they do not have a set processes or guidelines to follow. Thus,
healthcare organizations must implement Big Data Governance program with a reliable and robust
ethical code, along with process, training, people, and metrics to govern the
use of Big Data program in the organization (Bell et al., 2014).
The second key challenge is the maintaining the original privacy and
security requirements of data throughout
the information lifecycle. When adopting
Big Data, the collected data can be correlated
with other data sets which may ultimately create new datasets or alter the original data in different, often in unforeseen
ways. Healthcare organizations must
ensure that all security and privacy requirements that are applied on the original
data set are tracked and maintained across Big Data processes throughout the
information lifecycle from data
collection to disclosure or retention/destruction (Bell et al., 2014).
The re-identification risk is the third key Big Data Security and Privacy
challenge. The data which has been processed,
enhanced, or modified by Big Data programs may have internal and external
benefit to the organization. The data
must be anonymized to protect the privacy of the original data sources, such as
customers, or vendors. The data which is
not anonymized adequately before external release can result in the
compromise of data privacy because the data is
combined with previously collected, complex
data sets including geo-location, image, recognition, and behavioral tracking.
If the data is de-identified, a possible
correlation between data subjects contained within separate datasets must be
evaluated, because the third parties with access to several data sets can
re-identify otherwise anonymous individuals (Bell et al., 2014).
The fourth key Big Data Security and Privacy challenge involve third parties
and the usage and honoring the contractual obligations. The matching datasets from other
organizations may help unlock insights using Big Data which healthcare
organization could not discover with its data alone. However, such a matching dataset can also
post threats because third-party vendors
might not have the adequate security and privacy data protection. Healthcare organizations must evaluate the
relevant practices and decide whether they are satisfactory before sharing data
with third parties (Bell et al., 2014).
The last key Big Data Security and Privacy challenge involve the current interpreting regulations and anticipating future regulations. The United States and the EU do not have laws
or regulations specific to Big Data.
However, existing laws are restricting
the collection, use, and storage of specific personal information types, including health, financial and children’s
data. Big Data compliance has seen an
increased degree of regulatory scrutiny, as evidenced by the FTC’s recent
emphasis on Data Brokers and the Article 29 Data Protection Working Party’s
Opinion on the potential impact of the purpose limitation principle on Big Data
and open data. Healthcare organizations
must perform an initial inventory of applicable laws and update this inventory
on a regular basis to maintain current with quickly changing and newly implemented laws which impact the
implementation of Big Data (Bell et al., 2014).
Moreover, the impact of International Laws on the implementation of Big Data
in the healthcare industry is also seen in other areas. It is very critical to store health
information in secure and private
databases. A high number of legal and compliance challenges come along with the
size and complexity of the databases of Big Data Analytics. The primary concern of users and patients is the
trustworthiness when confronted with the usage of their health information (BDV, 2016). The disclosure of medication records,
lifestyle data, and health risks intentionally or unintentionally can
compromise the patients and their relatives. Privacy is a significant concern for adopting Big Data
Analytics in the healthcare
industry. Healthcare organization must
fully comply with the existing regulations, standards, and rules at the
national level as well as international level to ensure privacy protection as
well as to avoid costly penalties for non-compliance.
The analysis on the aggregated level is challenging. The current approaches to analyze data
sources available in a specific domain but connecting these different databases
across domains or repositories to perform analysis on the aggregated level is
the upcoming challenge which needs to be
addressed to unleash the full potential of Big Data Analytics in the healthcare industry. Several conflict and risks have to be
addressed to accomplish the ambitious plan of combining health databases with new anonymization and pseudonymization
approaches to ensure privacy (BDV, 2016).
The data integration is challenging in the presence of national and
international health data standards. The multiple data sources can be
integrated if there are standards and data integration tools, and methods and
tools for integrating such structures, unstructured data. The relation between national and
international health data standards represents a data integration limitation. Example of such a limitation includes the use of “xDT” in Germany which is not yet
mapped to its international counterpart in the HL7 framework. Big Data Analytics solution for the
healthcare industry will not be able to integrate the data fields relevant to given
analytics tasks without such a mapping.
The accessibility of Big Data of healthcare is very minimal for health
data analytics and Decision Support Systems due to the heterogeneous formats and the lack of common vocabulary (BDV, 2016). The vocabulary standards are used to describe
clinical problems and procedures, medications, and allergies. Examples of such a challenge include various
standards and codes such as International Classification
of Disease (ICD9 and ICD10), Current Procedural Terminology
4th Edition (CPT 4), Atomic Therapeutic Chemical Classification of
Drugs, and so forth.
The interoperability is another challenging when adopting Big Data in the healthcare industry in the presence of the international
and national standards. There is a couple of interoperability to be
implemented to facilitate the use of BDA in healthcare. The syntactic interoperability
is required to unify the format of knowledge sources to enable distributed query. The syntactic interoperability can be
implemented by conforming to universal knowledge representation languages and
by adopting standards practices (BDV, 2016). The widely adopted RDF, OWL, and LOD
approached to support the syntactic interoperability. The semantic interoperability is also
required to provide a uniform data representation and formalizing all concepts
into a holistic data model which is conceptual interoperability. The conceptual interoperability is domain
specific and cannot be implemented only by the adoption of standards tools and
practices, but also through interlinking
with existing healthcare knowledge-bases using
domain experts and semi-automated solutions.
The heterogeneous and large data
sources in the healthcare industry add further challenge because the different
semantic perspectives must be addressed to cope with knowledge source
conceptualizations.
Thus, several international organizations and entities across the world such
as the World Health Organization (WHO)
utilize the semantic knowledge-bases in the healthcare
system to accomplish the following goals (BDV, 2016):
Improve the accuracy of diagnoses by providing real-time correlations of symptoms, test
results, and medical histories of the
patients.
Assist in building more powerful and more interoperable information systems in healthcare.
Provide semantic-based criteria to support
different statistical aggregations for different purposes.
Support the need for
the healthcare process to transmit, re-use and share patient data.
Bring healthcare systems to support the
integration of knowledge and data.
Use Case Example
The European regulatory privacy landscape is currently evolving as the European Commission is in the process of implementing Data Protection reform to replace the existing EU Data Protection Directive. The proposed Regulation contains clauses which present a potential challenge to the adoption of Big Data including guaranteeing data subject a “Right to be Forgotten” and more options for Explicit Consent.
As indicated in (Bell et al., 2014), the Court of Justice of the European Union
issues a ruling on May 13, 2014,
requiring Google to remove from its search results personal data related to a
Spanish man contained in a 1998 news article. The Court further held to whether
the directive enables data subjects to a “right to be forgotten.” As a result, an initiative including the Article 29 Working Party’s Opinion on Purpose Limitation and Big Data
Public Private Forum (BIG) seek to provide clear strategic guidance to the
growth of Big Data across Europe.
The regulatory entities have imposed substantial
fines in high-profile cases including the largest settlement ever under HIPAA
of $4.8 million as the prime challenge with Big Data complies with these
existing international and national laws. The industry speculation what the
Target breach could result in fines between $400 million and $1.1 billion (Bell et al., 2014).
In summary, the various international and national laws have a negative impact on the adoption of Big
Data although Big Data and Big Data Analytics provide significant benefits to the healthcare
industry. Thus, healthcare organization
must pay attention and be alert to these regulations and laws which keep
modified to ensure privacy protection to the patients.
References
Abernathy, R.,
& McMillan, T. (2016). CISSP Cert
Guide: Pearson IT Certification.
The purpose of this discussion is to discuss and analyze the design of a data audit system for health informatics, and the elements of the system design. The audit is part of the security measures, which must be implemented by organizations for privacy protection. Organizations must comply with regulations and rules such as HIPAA to protect the private information of the patients.
Data Audit System for Healthcare Informatics
Although significant progress in technological security solution such as information access control, the operational process is still confronted with a significant challenge (Appari & Johnson, 2010). In healthcare, the data access is provided broadly, and the “Break the Glass” (BTG) policy is adapted to facilitate the care effectively and promptly due to the nature of healthcare and the various purpose (Appari & Johnson, 2010). The BTG policy allows the granting emergency access to the critical electronic protected health information (ePHI) system by providing a quick approach for a person who does not have access privileges to specific information to gain access when required. As indicated in (Appari & Johnson, 2010), 99% of doctors were granting overriding privileges while only 52% required overriding rights on a regular basis, and the security techniques of health information systems were overridden to access 54% of the patients’ information. Moreover, the BTG policy can be misused by the employees (Appari & Johnson, 2010). As indicated in (Malin & Airoldi, 2007), a study found that 28 of 28 Electronic Medical Record (EMR) system incorporate audit capability, yet only 10 of the systems alert healthcare admin of potential violation. Thus, there is a serious need for healthcare organizations to design and implement a robust audit system to avoid such pitfalls that can lead to serious malicious attacks and data breaches.
Various research studies have exerted efforts and
proposed audit systems to address these pitfalls and ensure the proper Security
Policy with an appropriate Audit system and the implementation of such a policy
correctly. In (Malin & Airoldi, 2007), the researchers proposed
a novel protocol called CAMRA (Confidential Audits of Medical Record Access)
which allows an auditor to access information from non-EMR systems without revealing the identity of those being investigated. In (Rostad & Edsberg, 2006), the researchers
discussed and analyzed the role-based access control systems in healthcare, which
are often extended with exception mechanisms to ensure access to needed
information even when the needs do not follow the proper methods. The researchers recommend the limited use of
the exceptions mechanisms because they increase the threats to patients’
privacy and subject to auditing. In (Bhatti & Grandison, 2007), the researchers
proposed a model called PRIMA (PRIvacy Management Architecture) to exploit
policy refinement techniques to gradually and seamlessly embed the privacy
controls into the clinical workflow. The
underlying concept of the PRIMA is based on the Active Enforcement and
Compliance Auditing component of the Hippocratic Database technology and
leverages standard data analysis technique. In (Ferreira et al.), the researchers
discussed and analyzed the BTG policy in a Virtual EMR (VEMR) system integrated
with the access control model already in use.
One of the requirements of the
Access Control model involves auditing and monitoring mechanisms which must be
in place at all times for all users. In (Zhao & Johnson, 2008), the researchers proposed
a governance structure based on controls and incentives where employees’
self-interested behavior can result in the firm-optimal
use of information. The result of their
analysis indicated that the Audit quality is a critical
element of the proposed governance scheme.
The Role of Audit as a Security Measure
The security has three main principles known as CIA Triad: Confidentiality, Integrity, and Availability. There are additional security concepts known as the five elements of the AAA services; Identification, Authentication, Authorization, Auditing, and Accounting. The AAA services include the Authentication, Authorization, and Accounting or sometimes Auditing. The Identification reflects the identity when attempting to access a secured area or system. The Authentication is to prove the identity of the user. The Authorization defines the “allow” and “deny” of resources and object access for a specific identity. The Auditing is used to record a log of the events and activities related to the system and subjects. The Accounting (a.k.a Accountability) is used to review the log files to check for compliance and violations to hold users accountable for their actions (Stewart, Chapple, & Gibson, 2015).
The Auditingis
the programmatic techniques to track and record actions to hold the users accountable for their actions while authenticated
on the system. The Auditing is also used
to detect unauthorized users and abnormal
activities on the system. The Auditing
is also to record activities of the users and the activities of the core system
functions which maintain the operating environment and the security
techniques. The Audit Trails which get
created by the recording system events to logs can be utilized to evaluate the
health and performance of the system.
The crashes of the system indicate faulty programs, corrupt drivers, or
intrusion attempts. The event logs can
be used to discover the reason a system failed.
Auditing is required to detect malicious actions by users, attempted
intrusions, and system failures and to reconstruct events, provide evidence for
the prosecution, and produce problem
analysis and reports. The Auditing
provides Accountability. It tracks users
and records the time they access objects and files, creates an Audit Trail in
the audit logs. For instance, the
Auditing can record the time of a user reads, modifies, or delete a file
(Stewart et al., 2015).
Auditing is a native feature of the operating systems
and most applications and services.
Thus, a security professional must
ensure the auditing feature is enabled and
configured on the systems, applications or services to monitor and records all
activities including the malicious events. Moreover, most firewalls offer extensive
auditing, logging, monitoring capabilities, alarms and primary intrusion detection system (IDS) functions. Every system must have the appropriate
combination of a local host firewall, anti-malware scanners, authentication,
authorization, auditing, spam filters and IDS/IPS services. Many organizations require the retention of
all audit logs for three years or longer to enable organizations to reconstruct
the details of past security incidents (Stewart et al., 2015). Every organization must have a Retention
Policy that provides the rules for retaining such audit logs to comply with
HIPAA investigations.
The Role of the Auditor
The auditor must review and verify that the Security Policy is implemented properly and the security solutions are adequate. The Auditor produces compliance and effectiveness reports to be reviewed by the senior management. The senior management transforms the issues discovered in these reports are transformed into new directives. Moreover, the role of the Auditor is to ensure a secure environment is properly protecting assets of the organizations (Stewart et al., 2015).
HIPAA Audit Requirement Compliance
The Audit Trails are records with retention requirements. Healthcare Information Management should include them in the management of the electronic health records. The legal requirements and compliance drive the Audit Trail management. HIPAA Audits have been occurring around the country resulting in judgments of substantial fines; organizations must sustain less risk and robust Audit Trails for their clinical applications (Nunn, 2009).
Audit Trail is
distinguished from Audit Control.
As cited in (Nunn, 2009), the Audit Trail
is defined by the Fundamentals of Law for Health Informatics and Information
Management as a “record that shows who had
accessed a computer system, when it was accessed, and what operation was performed.”
The Audit Control is a term used by the IT professional which is defined as “the mechanisms employed to
record and examine system activity. The data collected and potentially used to
facilitate a security audit is called the audit trail that in turn may consist
of several audit files located on different entities of a network” (Nunn, 2009). This distinction
indicates that it may take several different audit trails of systems to detect
inappropriate access or malicious intrusions into the clinical databases.
Organizations must conduct routine random audits on a regular base to ensure the compliance with
HIPAA and other regulations to protect the privacy of the patients. Audit Trails can track all system activities
including a detailed listing of content,
duration, and the users, generating date
and time for entries and logs of all modifications to EHRs. The routine audit can assist in capturing the
inappropriate use and access by unauthorized users. When there is inappropriate access to a
medical record, the system can generate information about the name of the
individual gaining access; the time, data, screens accessed and the duration of
the review. This information can assist
in providing evidence for prosecution if the access was not authorized or there
is a malicious attack or data breach.
HIPAA Security Rule requires organizations to conduct Audit Trails and
document information system activities, and have the hardware, software, and
procedures to record and examine these activities that contain health
information (Ozair, Jamshed, Sharma, & Aggarwal, 2015; Walsh
& Miaoulis, 2014).
In summary, healthcare organization must ensure to
implement Audit system to comply with regulations such as HIPAA to ensure the
protection of the patients’ private information. The Audit system should consider the Audit
Trail techniques to track the system activities and the access by users to the
health information. The limited access
to authorized users is recommended. The BTG policy is misused in healthcare. It
should be applied for exceptions
only. However, it has been applied to users who do not necessarily
have any exception to access the health records. The audit
is also used to detect fraud activities.
Thus, the organization must take
advantages of various hardware and software to implement the Audit system not
only to protect the privacy of the patients
but also to detect fraud.
References
Appari, A., & Johnson, M. E.
(2010). Information security and privacy in healthcare: current state of
research. International Journal of
Internet and enterprise management, 6(4), 279-314.
Bhatti, R., &
Grandison, T. (2007). Towards improved
privacy policy coverage in healthcare using policy refinement. Paper
presented at the Workshop on Secure Data Management.
Ferreira, A.,
Cruz-Correia, R., Antunes, L., Farinha, P., Oliveira-Palhares, E., Chadwick, D.
W., & Costa-Pereira, A. How to break
access control in a controlled manner. Paper presented at the
Computer-Based Medical Systems, 2006. CBMS 2006. 19th IEEE International
Symposium on.
Malin, B., &
Airoldi, E. (2007). Confidentiality preserving audits of electronic medical
record access.
Ozair, F. F.,
Jamshed, N., Sharma, A., & Aggarwal, P. (2015). Ethical issues in
electronic health records: a general overview. Perspectives in clinical research, 6(2), 73.
Rostad, L., &
Edsberg, O. (2006). A study of access
control requirements for healthcare systems based on audit trails from access
logs. Paper presented at the Computer Security Applications Conference,
2006. ACSAC’06. 22nd Annual.
Stewart, J.,
Chapple, M., & Gibson, D. (2015). ISC
Official Study Guide. CISSP Security
Professional Official Study Guide (7th ed.): Wiley.
The purpose of
this project is to discuss and analyze Big Data and Big Data Analytics
in the healthcare industry. The discussion and the analysis cover the
benefits of BD and BDA in healthcare, and how the healthcare industry is not taking full
advantages of such great benefits.
The analyses also cover various
proposed BDA frameworks for healthcare with the advanced technology such as
Hadoop, MapReduce. The proposed BDA
ecosystem for healthcare includes various layers from Data Layers, Data
Aggregation Layer, Analytical Layer and Information Exploration Layer. These layers are controlled by the Data Governance
Layer to protect health information and ensure the compliance of HIPAA
regulations. The discussion and analysis
detail the role of BDA in healthcare for Data Privacy Protection. The analyses
also cover the HIPAA and Data Privacy Requirements, and the Increasing Trend of
Data Breaches and Privacy Violation in healthcare. The project proposes a policy for healthcare
Data Security and Privacy Protection. The proposed policy covers the general principles of HIPAA, the implications for
violating HIPAA regulations. The project detailed the elements of the
proposed policy and the Risk Analysis
that is required as the first element in
the proposed policy.
Keywords:
Big Data Analytics, Healthcare, Data Privacy, Data
Protection.
The healthcare
industry is continuously generating a large
volume of data resulting from record keeping, patients related data, and
compliance. As indicated in (Dezyre, 2016), the US
healthcare industry generated 150 billion gigabytes, which is 150 Exabytes of data in 2011. In the era of information technology and
digital world, the digitization of the data is becoming mandatory. The analysis of such large volume of the data is critically required to improve the
quality of healthcare, minimize the healthcare related costs, and respond to
any challenges effectively and promptly. Big Data Analytics (BDA) offers great opportunities in the healthcare industry
to discover patterns and relationships using the machine learning algorithms to gain meaningful insights
for sound decision making.
Although there are various benefits
of the implementation of Big Data Analytics, healthcare industry continues to
struggle to gain full benefits from the investments on BDA, and some healthcare
organizations doubt the benefits and the
advantages of the application of BDA technologies. As indicated in (Wang, Kung, & Byrd, 2018) only 42% of
healthcare organizations are taking advantages of BDA to support the
decision-making process, 16% of them have substantial experience using
analytics across a broad range of functions.
The result of such a survey shows that there is a lack of understanding
about the key role of BDA in the healthcare industry (Bresnick, 2017; Wang et al., 2018). Thus,
there is an urgent need for the healthcare
industry to comprehend the impact of BDA and explore the potential benefits of
BDA at the managerial level, economic level, and strategic level (Wang et al., 2018). Healthcare organizations must also comprehend
the implementation of data governance and regulations such as HIPAA to protect
healthcare data from threats, risks, and
any data breach. All organizations including healthcare organizations must fully understand
the impact of breaking or violating these regulations and rules.
This project addresses the Big Data
Analytics in Healthcare industry, techniques and methods to meet the data
privacy required by HIPAA. The project also proposes a policy for healthcare
organization which explains the consequences of a data breach at the personal, patients and organizations level. The importance of using the BDA with security
measures is also discussed in this
project. Moreover, the project discusses
and analyzes the steps required to comply with data privacy rules and HIPAA
regulations.
Healthcare
generates various types of data from various sources such as physician notes,
X-Rays reports, Lab reports, case history, diet regime, list of doctors and
nurses, national health register data, medicine and pharmacies, medical tools,
materials and instruments expiration data identification based on RFID data (Archenaa & Anita, 2015; Dezyre, 2016; Wang et al., 2018).
Thus, there has been an exponentially
increasing trend in generating healthcare data, which resulted in an
expenditure of 1.2 trillion towards healthcare data solutions in the healthcare
industry (Dezyre, 2016). The healthcare organizations rely on Big Data
technology to capture this healthcare information about the patients to gain
more insight on the care coordination, health management, and patient
engagement. As cited in (Dezyre, 2016), McKinsey
projects the use of Big Data in the healthcare
industry can minimize the expenses associated with healthcare data management
by $300-$500 billion, as an example of the benefits from using BD in
healthcare.
Big
Data Analytics offers various benefits to healthcare organizations (Jee & Kim, 2013). These benefits include providing patient-centric services. Healthcare organizations can employ Big Data
Analytics in various areas such as detecting diseases at an early stage, providing evidence-based medicine,
minimizing the doses of the drugs to avoid side effects, and delivering
efficient medicine based on genetic makeups.
The use of BDA can reduce the re-admission rates and thereby the
healthcare related costs for the patients are also reduced. BDA
can also be used in the healthcare
industry to detect spreading diseases earlier before the disease gets spread
using real-time analysis. The analysis
includes social logs of the patients who suffer from a disease in a particular
geographical location. This analytical process can assist healthcare
professionals to provide to the community take the preventive measures. Moreover, BDA is also used in the healthcare industry to monitor the quality of
healthcare organizations and entities such as hospitals. The treatment methods can be improved using
BDA by monitoring the effectiveness of medications (Archenaa & Anita, 2015; Raghupathi &
Raghupathi, 2014; Wang et al., 2018). Examples of the Big Data Analytics in
Healthcare industry include Kaiser Permanent implementing a HealthConnect technique to ensure data exchange
across all medical facilities and promote the use of electronic health records.
AstraZeneca and HealthCore have joined n alliance to determine the most
effective and economical treatments for some chronic illness and common
diseases based on their combined data (Fox & Vaidyanathan, 2016).
It
is very important for healthcare organization IT professionals to understand
the framework and the topology of the BDA for the healthcare organization to
apply the security measures to protect patients’ information. The new framework for healthcare industry include the
emerging new technologies such as Hadoop, MapReduce, and others which can be utilized to gain more insight in various
areas. The traditional analytic system
was not found adequate to deal with a large volume of data such as the
healthcare generated data (Wang et al., 2018). Thus, new technologies such as Hadoop and its
major components of the Hadoop Distributed File System (HDFS), and MapReduce
functions with NoSQL databases such as HBase,
and Hive were emerged to handle a large
volume of data using various algorithms and machine learnings to extract value
from such data. Data without analytics has no value. The analytical process turns the raw data
into valuable information which can be used to save lives, predict diseases,
decrease costs, and improve the quality of the healthcare services.
Various
research studies addressed various BDA
frameworks for healthcare in an attempt to shed light on integrating the new
technologies to generate value for the healthcare. These
proposed frameworks vary. For instance,
in (Raghupathi & Raghupathi, 2014), the framework involved various layers. The layers included Data Source Layer,
Transformation Layer, Big Data Platform Layer, and Big Data Analytical
Application Layer. In (Chawla & Davis, 2013), the
researchers proposed personalized
healthcare, patient-centric framework, empowering patients to take a more
active role in their health and the health
of their families. In (Youssef, 2014), the
researcher proposed a framework for secure healthcare systems based on BDA in
Mobile Cloud Computing environment. The
framework involved the Cloud Computing as
the technology to be used for handling big
healthcare data, the electronic health
records, and the security model.
Thus,
this project introduces the framework and the ecosystems for BDA in healthcare
organizations which integrate the data governance to protect the patients’
information at the various level of data
such as data in transit and storage. The researcher of this project is in agreement with the framework proposed by (Wang et al., 2018), as it is a
comprehensive framework addressing various data privacy protection techniques
during the analytical processing. Thus,
the selected framework for this project
is based on the ecosystems and topology of (Wang et al., 2018).
The framework consists of major layers of the Data Layer, Data Aggregation Layer, Analytics Layer, Information Exploration Layer, and Data Governance Layer. Each layer has its purpose and its role in the implementation of BDA in the healthcare domain. Figure 1 illustrates the BDA framework for healthcare organizations (Wang et al., 2018).
Figure 1. Big Data Analytics Framework in Healthcare (Wang et al., 2018).
The framework consists of the Data
Governance Layer that is controlling the data processing starting from
capturing the data, transforming the data, and the consumption of the data. The
Data Governance Layer consists of three key
elements; the Master Data Management element, the Data Life-Cycle Management
element, and the Data Security and Private Management element. These three major elements of
the Data Governance Layer to ensure the proper use of the data, the data
protection from any breach and unauthorized access.
The Data Layer represents the
capture of the data from various sources such as patients’ records, mobile
data, social media, clinical and lab results, X-Rays, R&D lab, home care
sensors and so forth, as illustrated in Figure 2. This data is
captured in various types such as structured, semi-structured and
unstructured formats. The structured
data represent the traditional electronic healthcare records (EHRs). The video, voice, and images represent the unstructured data type. The machine-generated data forms semi-structured
data, while transactions data including
patients’ information forms structure data.
These various types of data represent the variety feature which is one
of the three major characteristics of the
Big Data (volume, velocity, and variety).
The integration of this data
pools is required for the healthcare industry
to gain major opportunities from BDA.
The
Data Aggregation Layer consists of three major
steps to digest and handle the data; the acquisition of the data, the
transformation of the data, and data storage.
The acquisition step is challenging because it involves reading the data
from various communication channels including frequencies, sizes, and formats.
As indicated in (Wang et al., 2018), the
acquisition of the data is a major
obstacle in the early stage of BDA implementation as the captured data has
various characteristics, and budget may get exceeded to expand the data
warehouse to avoid bottlenecks during the workload. The transformation step involves various process steps such as the data moving step, the cleaning step, splitting step,
translating step, merging step, sorting step, and validating data step. After the data gets transformed using various
transformation engines, the data are loaded into storage such as HDFS or in Hadoop Cloud for further processing and
analysis. The principles of the data
storage are based on compliance
regulations, data governance policies and access controls. The data storage techniques can be
implemented and completed using batch process or during the real-time.
The Analytics Layer involves three main operations; the Hadoop MapReduce, Stream
Computing, and in-database analytics based on the type of the data. The MapReduce operation is the most popular
BDA technique as it provides the capability to process a large volume of data in the batch form in a cost-effective fashion and to
analyze various types of data such as structured and unstructured data using massively parallel processing (MPP). Moreover, the analytical process can be at
the real-time or near real time. With respect to the real-time data analytic
process, the data in motion is tracked,
and responses to unexpected events as they occur and determine the next-best actions quickly. Example include the healthcare fraud
detection, where stream computing is a key
analytical tool in predicting the likelihood of illegal transactions or
deliberate misuse of the patients’ information.
With respect to the in-database
analytic, the analysis is implemented through the Data Mining technique using
various approaches such as Clustering, Classification, Decision Trees, and so
forth. The Data Mining technique allows data to be
processed within the Data Warehouse providing high-speed
parallel processing, scalability, and optimization features with the aim to
analyze big data. The results of the
in-database analytics process are not current or real-time. However, it
generates reports with a static prediction, which can be used in healthcare to
support preventive healthcare practices
and improving pharmaceutical management.
This Analytic Layer also provides significant support for evidence-based medical practices by analyzing
electronic healthcare records (EHRs), care experience, patterns of care,
patients’ habits, and medical histories (Wang et al., 2018).
In the Information Exploration
Layer, various visualization reports, real-time information monitoring, and
meaningful business insights which are derived
from the Analytics Layer are generated to assist organizations in making better
decisions in a timely fashion. With respect to healthcare organizations, the
most important reporting involves
real-time information monitoring such as alerts and proactive notification, real-time data navigation, and operational
key performance indicators (KPIs). The
analysis of this information is implemented
from devices such as smartphones, and
personal medical devices which can be sent to interested users or made
available in the form of dashboards in real-time for monitoring patients’
health and preventing accidental medical events. The value of remote monitoring is proven for
diabetes as indicated in (Sidhtara, 2015), and for heart
diseases, as indicated in (Landolina et al., 2012).
The benefits of Big Data and Big Data Analytics are not questionable in Healthcare industry. Several research studies and practitioners are in agreement that healthcare industry can benefit greatly from BD and BDA technologies in various areas such as reducing the healthcare costs for patients as well as for healthcare organizations, providing quality services, predicting diseases among potential patients, and more. Moreover, there are also agreement and consensus among the researchers and practitioners about the security requirements for the patients’ information and the protection requirements for the data privacy from unauthorized access or data breaches.
As indicated in (himss.org, 2018), medical and healthcare entities accounted for 36.5% of the
reported data breaches in 2017. In accordance with a recent report published by
HIPAA, the first three months of 2018
experienced 77 healthcare data breaches reported to the Department of Health
and Human Services’ Office for Civil Rights (OCR). The report added that the impact of these
breaches was significant as more than one million patients and health plan
members were affected. These breaches are estimated to be almost
twice the number of individuals who were impacted by healthcare data breaches
in Q4 of 2017. Figure 3 illustrates
such increasing trend in the Healthcare Data Breaches (HIPAA, 2018).
Figure 3: Q1, 2018 Healthcare Data Breaches (HIPAA, 2018).
As reported in the same report, the
healthcare industry is unique with respect to
the data breaches because they are caused mostly by the insiders; “insiders
were behind the majority of breaches” (HIPAA, 2018). Other reasons
involve improper disposal, loss/theft, unauthorized access/disclosure
incidents, and hacking incidents. The largest
healthcare data breaches of Q1 of 2018 involved
18 healthcare security breaches which impacted more than 10,000
individuals. The hacking/IT incidents
involved more records than any other breach cause as illustrated in Figure
4 (HIPAA, 2018).
Figure 4. Healthcare Records Exposed by Breach Cause (HIPAA, 2018).
The worst affected by the healthcare
data breaches in Q1 of 2018 involved the healthcare providers. With respect
to the states, California was the worst affected state with 11 reported
breaches and Massachusetts with eight
security incidents.
Health Insurance Portability and
Accountability Act (HIPAA) of 1996 is U.S. legislation which provides data
privacy and security provisions for safeguarding medical information. Every organization
including healthcare organizations must comply and meet the requirements of
HIPAA. The compliance of HIPAA is
critical because the privacy and security of the patients’ information are of the most important aspect in healthcare
domain. The goal of the security is to
meet the CIA Triad of Confidentiality, Integrity, and Availability. In healthcare domain, organizations must
apply security measures by utilizing commercial software such as Cloudera
instead of using open source software which may be
exposed to security holes (Fox &
Vaidyanathan, 2016).
The Data Privacy concern is caused by the potential data breaches and data leak of the patients’
information. As indicated in (Fox &
Vaidyanathan, 2016), the cyber thieves routinely target the
medical records. The Federal Bureau of
Investigation (FBI) issued a warning to healthcare providers to guard their
data against cyber attacks, after the incident of the Community Health Systems
Inc., which is regarded to be one of the largest U.S. hospital operators. In this particular incident, 4.5 million
patients’ personal information were stolen
by Chinese hackers. Moreover, the names and addresses of 80 million patients
were stolen by hackers from Anthem, which is regarded to be one of the largest
U.S. health insurance companies.
Although the details of the illnesses of these patients and treatment
were not exposed, however, this incident shows how the healthcare industry is exposed
to cyber attacks. There is an increasing
trend in such privacy data breach and data loss through cyber attacks
incidents.
The number of threats and data breach
incidents exposing patients’ information to unauthorized users and cyber
attacks has expanded over the years. As indicated in (Fox &
Vaidyanathan, 2016), data breaches cost healthcare industry about $6 billion. A study conducted by Ponemon, as cited by (Fox &
Vaidyanathan, 2016) showed that healthcare organizations failed
to perform a risk assessment for security
incidents. Moreover, the study also
showed that healthcare organizations are struggling to comply with federal and
state privacy and security regulations such as HIPAA.
HIPAA added a new part of Title 45 of the
Code of Federal Regulation (CFR) for health plans, healthcare providers, and
healthcare clearinghouses in general. As
indicated in (Fischer,
2003), the new regulations include five basic principles which must
be adhered to by healthcare entities.
The first principle includes the consumer control where the regulation
provides patients with critical new rights to control the release of their
medical information. The second
principle includes the boundaries, which
allows the use of the healthcare information of patients for health purpose
only including treatment and payment, with few exceptions. The third principle includes the accountability, which enforces specific federal
penalties if a patient’s right to privacy is
violated. The fourth principle includes the public responsibility which
reflects the need to balance privacy protections with the public responsibility
to support such national priorities as protecting public health, conducting
medical research, improving the quality of care, and fighting healthcare fraud
and abuse. The last principle is the
security which organizations must implement to protect against deliberate or
inadvertent misuse or disclosure.
Thus,
HIPAA requires three main implementations for these principles. The first requirement involves the
standardization of EPHs, administrative and financial data. The second
requirement involves unique health identifiers for individuals, employers,
health plans and healthcare
providers. The third implementation
requirement involves security standards
to protect the confidentiality and integrity of “individually identifiable
health information” present, past and future (Fischer,
2003). The implementation of
these three requirements is critical to
comply with these five principles.
With respect
to privacy and security which are very related,
HIPAA regulations cover both where confidentiality is part of the privacy
rule. Privacy and security are
distinguished, yet they are related. As
defined in (Fischer,
2003), “Privacy is the right of the individual
to control the use of his or her personal information.” This personal
information should not be used against
the well of the person. Confidentiality becomes an issue when the personal information is received by another entity. Confidentiality means protecting the
information by safeguarding it from unauthorized disclosure. Security, on the other hand, refers to all of
the physical, technical, and administrative safeguards which are placed and
implemented to protect the information. Security
involves the protection of systems from unauthorized internal or external
access, data in storage or data in transit.
Thus, security and privacy are distinguished but related; there is no
one without the other (Fischer,
2003).
The Privacy Rule of HIPAA focuses on the way
PHI is handled by an entity and between
healthcare organizations and other covered entities
and includes both papers as well as
electronic records. The Five HIPAA
Privacy Rules are summarized in Figure 5.
Figure 5. HIPAA Privacy Rules. Adapted from (Fischer, 2003).
Organizations must comply with HIPAA Privacy
Rules. Thus, organizations must
implement reasonable and appropriate security measures to comply with HIPAA
Privacy Rules. These security measures
and rules involve internal and external threats, security threats and vulnerability,
and include the protection of computers (servers and clients), transit and
store the medical data and related information of the patients. Moreover, additional measures such as
policies formalization and documentation, logging to create audit trails to
monitor the access of users or the modification of PHI (Fischer,
2003).
HIPAA required healthcare organizations to
assess the potential risks and vulnerabilities by performing gap and risk
analysis. It also requires organizations
to protect against threats to information security or integrity, and against
unauthorized use or disclosure.
Organizations are also required to implement and maintain security measures which are appropriate to needs,
capabilities, and circumstances. Moreover, the organization
is required by HIPAA rules to ensure
compliance with these safeguards by all staff (Fischer,
2003).
The implications of data breaches and the
non-compliance with the privacy regulations such as HIPAA are serious. Healthcare organizations are directly liable
for violating HIPAA rules. Such violation includes
the failure to comply with Security Rule, impermissible use and disclosure, and
failure to provide breach notification (Fox &
Vaidyanathan, 2016).
Thus, it is very critical for a healthcare organization to comply with HIPAA
regulations. Thus, healthcare organization
must consider security measures during the application of BDA, and apply the
privacy protection measures at every level of BDA framework. Healthcare organizations are required to
implement security measures to protect the ePHI through the appropriate safeguards
such as administrative, physical and technical (Fox &
Vaidyanathan, 2016). The security measures to protect
healthcare information can be implemented
by using security constraints such as access control, an encryption technique, multi-factor
authentication technique, secure socket layer (SSL) technique (Fox &
Vaidyanathan, 2016; Gardazi & Shahid, 2017; Youssef, 2014).
Various
governments documentations details the financial implications for the
organizations which do not comply with the HIPAA regulations. In accordance with (hhs.gov,
2003), there two types of enforcement and penalties for
non-compliance with HIPAA regulations.
The civil money penalties may be imposed on a covered entity of $100 per
failure to comply with the Privacy Rule requirement. This penalty may not
exceed $25,000 per year for multiple violations of the identical Privacy Rule
requirement in a calendar year. With respect to the criminal penalties, there
is a fine of $50000 and up to one-year imprisonment for the individual who
obtains or disclose individually identifiable
health information in violation of HIPAA.
The criminal penalties increase to $100,000 and up to five years
imprisonment if the wrongful conduct involves pretenses,
and to $250000 and up to ten years imprisonment if the wrongful conduct
involves the intent to sell, transfer, or use individually
identifiable health information for commercial advantage, personal gain, or
malicious harm. These criminal sanctions
are enforced by the Department of Justice (hhs.gov,
2003).
Moreover, in 2013, Health and Human
Services’ Office for Civil Rights (HHS) released its final regulations
expanding privacy rights for patients and others. The new rules include major changes in medical record privacy measures required of health
providers by HIPAA and Health Information Technology for Economic and Clinical
Health Act (HITECH). The rules expand
the privacy measures to apply additional groups which have access to the
information of the patients “regardless of whether the information is being held by a health plan, a health care
provider, or one of their business associates” (ncsl.org,
2016). This change expands
many of the requirements to business associates of these healthcare entities
which receive protected health information such as contractors and
sub-contractors, as some of the largest
breaches reported to HHS involved business associated. The penalties are
increased for noncompliance based
on the level of negligence with a maximum penalty of $1.5 million per violation
(ncsl.org,
2016).
It is very
essential for a healthcare
organization to comply with HIPAA regulations.
Organizations which are breached and not compliant with HIPAA
regulations can face financial consequences as summarized in Table 1, adapted
from (himss.org, 2018).
Table 1. Financial Consequences for Violating HIPAA Regulations. Adapted from (himss.org, 2018).
The statistical analysis and the
increasing trend in the data breach reporting incidents indicate that there is
a serious need for healthcare entities to
comply with the HIPAA regulations to protect the privacy of the patients and
individuals. There are three major HIPAA rules which healthcare organizations must comply with:
Security Rule, Privacy Rule, and Breach Rule.
The main
goal to comply with HIPAA regulations is to protect the privacy of health
information of patients and individuals
while allowing the organization to adopt
new technologies such as BDA emerging technologies to improve the quality and
efficiency of patient care. Some of the
requirements for the Security Rule of HIPPA attempt to make it more difficult
and harder for attackers to install malware and other harmful viruses onto the
systems. Examples of these requirements
to enforce security measures Rule include:
of security awareness
and training program for all workforce members including management (himss.org, 2018).
The
BDA healthcare framework should be developed to comply with HIPAA regulations.
The first step for compliance involves the Risk assessment and Analysis and Risk
Management Plan. The purpose of this
step is to identify and implement safeguards which comply with and execute the
standards and specifications in the Security Rule. The Risk Analysis is the foundation to assess
the potential vulnerabilities, threats, and risks to the PHI. Every healthcare organization must begin with
the Risk Analysis is to assist in documenting the potential security vulnerabilities, threats, and risks to the patient’s information. Healthcare organizations must maintain identity everywhere PHI is
created and enters the healthcare entity.
The entry points of PHI include emails, texts, people involved and
locations used in entering electronic health records,
new patients information, business associate communications, and the databases
used and their locations. Moreover,
healthcare organizations must know the
storage of the patient health information such as EMR/EHR systems, mobile
devices, servers, workstations, wireless medical devices, laptops, computers, and
so forth. The Risk Analysis should
detail the scope of the analysis, the collection of the data procedures, the
vulnerabilities, threats and risks, the assessment of current security
measures, the likelihood of threat occurrence, the potential impact of the
threat, the risk level and the periodic
review and update as required. Figure 6
summarizes the elements of the Risk Analysis (himss.org,
2018).
Figure 6. Risk Analysis Elements. Adapted from (himss.org, 2018)
Organizations
must implement the Encryption techniques for PHI to protecting the patient’s information in case of data breaches
occurs. HIPAA does not specify the type
of the encryption. However, the industry best practice is to use AES-128,
Triple DES, AES-256, or better (himss.org,
2018). Moreover, organizations
must comply with HIPPA requirements for dealing with emails. In addition to the encryption requirement for
the emails, the emails should follow additional security measures such as
password procedures. The mobile devices should follow the Security
Rule of HIPAA as well. The best mobile
security practice is not to implement the “bring your own device” (BYOD)
strategy. However, since this
requirement is not practical, the organization
must consider using the guidelines of National Institute of Standards and
Technology (NIST) for healthcare providers and staff. These guidelines include the basic mobile
security practices such as secure wireless.
The organization should limit the
use of mobile devices to limit the risk associated with the mobile devices (himss.org,
2018).
As
indicated in (himss.org,
2018), the majority of physical data thefts take less than only minutes in planning and execution. Thus, the physical access to healthcare
organization must be protected. Examples of the physical access include the
security of offices, storage doors, windows, reception desks, access limit to
PHI through role-based access, and so forth. Healthcare organization must follow the best
practice for physical security and train all staff and physicians to ensure the
security requirements and safeguards are implemented (himss.org,
2018).
Healthcare
organization must implement the firewall technique to filter potentially
harmful internet traffic to protect valuable and sensitive PHI. The firewall can be hardware firewall,
software firewall, and web application firewall. The firewall must be configured and maintained
properly, otherwise the organization can
be put at risk. The firewall best practice includes the implementation of security
settings for each switch port, particularly if the network is segmented, the
continuous update of the firewall settings, the use of virtual private
networks, the establishment for inbound and outbound rules, and the segmentation
of the network using switch ports (himss.org,
2018).
Healthcare organizations should address all
known security vulnerabilities and be consistent with the industry-accepted
system hardening standards. Examples of
the best practice to comply with HIPAA regulation include disabling services
and features not in use, uninstalling applications not in need, limiting systems
to perform a single role, removing or disabling default accounts, and changing
the default passwords and other settings. System updates and patches must be implemented on a regular basis at every
level of the healthcare framework.
Use Access should be secured by changing the
default password weaknesses and enforcing
password procedures. Healthcare
organizations must implement the role-based access control to limit the access
to PHI to only the authorized users based on their roles. Access control is not limited to software and
hardware but also to physical locations.
Healthcare organization must follow HIPAA
regulations for logging and log management.
This requirement includes the
event, audit, and access logging to logs of each of the systems for a total of
six years (himss.org,
2018). Procedures for
monitoring log-in must be implemented to monitor all attempts including the
unauthorized user’s attempts. The audit controls include the implementation
of hardware and software techniques to record and examine activity in an information system which utilizes the protected health information. Moreover, the organization
must implement vulnerability scanning and penetration testing on a regular
basis.
The project
discussed and analyzed Big Data and Big
Data Analytics in the healthcare
industry. The discussion and the
analysis covered the benefits of BD and BDA in healthcare, and how the healthcare industry is not taking full advantages of such great benefits. The analyzes also covered various proposed
BDA frameworks for healthcare with the advanced technology such as Hadoop, MapReduce. The proposed BDA ecosystem for
healthcare includes various layers from
Data Layers, Data Aggregation Layer, Analytical Layer and Information
Exploration Layer. These layers are
controlled by the Data Governance Layer to protect health information and
ensure the compliance of HIPAA regulations.
The discussion and analysis detailed the role of BDA in healthcare for
Data Privacy Protection. This analysis also
covered the HIPAA and Data Privacy Requirements, the Increasing Trend of Data
Breaches and Privacy Violation in healthcare.
The project proposed a policy for healthcare Data Security and Privacy
Protection. The proposed policy covered the general principles of HIPAA, the
implications for violating HIPAA
regulations. The project detailed the
elements of the proposed policy and the Risk Analysis that is required as the first element in the
proposed policy.
In conclusion, the healthcare industry must pay more attention to
HIPAA regulations to protect health information from intruders either insiders
or outsiders, and take the proper security measures at every level from
physical access to system access. Security measures should include encryption
in case of attack occurs. With the
encryption, the data become unreadable.
Chawla,
N. V., & Davis, D. A. (2013). Bringing big data to personalized healthcare:
a patient-centered framework. Journal of
general internal medicine, 28(3), 660-665.
Fox,
M., & Vaidyanathan, G. (2016). IMPACTS OF HEALTHCARE BIG DATA: A FRAMEWORK
WITH LEGAL AND ETHICAL INSIGHTS. Issues
in Information Systems, 17(3).
Gardazi,
S. U., & Shahid, A. A. (2017). Compliance-Driven Architecture for
Healthcare Industry. INTERNATIONAL
JOURNAL OF ADVANCED COMPUTER SCIENCE AND APPLICATIONS, 8(5), 568-577.
Groves,
P., Kayyali, B., Knott, D., & Kuiken, S. V. (2016). The ‘Big Data’
Revolution in Healthcare: Accelerating Value and Innovation.
Jee,
K., & Kim, G.-H. (2013). Potentiality of big data in the medical sector:
focus on how to reshape the healthcare system. Healthcare informatics research, 19(2), 79-85.
Landolina,
M., Perego, G. B., Lunati, M., Curnis, A., Guenzati, G., Vicentini, A., . . .
Valsecchi, S. (2012). Remote Monitoring Reduces Healthcare Use and Improves
Quality of Care in Heart Failure Patients With Implantable
DefibrillatorsClinical Perspective: The Evolution of Management Strategies of
Heart Failure Patients With Implantable Defibrillators (EVOLVO) Study. Circulation, 125(24), 2985-2992.
Wang,
Y., Kung, L., & Byrd, T. A. (2018). Big data analytics: Understanding its
capabilities and potential benefits for healthcare organizations. Technological Forecasting and Social Change,
126, 3-13.
Youssef, A. E. (2014). A framework for secure
healthcare systems based on big data analytics in mobile cloud computing
environments.