Scalable and Intelligent Security Analytics Tools

Dr. Aly, O.
Computer Science

Abstract

The purpose of this project is to discuss and analyze scalable and intelligent security analytics tools from different vendors.  The discussion begins with an overview of SIEM and the essential capabilities of an analytics-driven SIEM.  The first generation of SIEM has been overwhelmed with the volume of the data and the rise of the advanced threats.  The second generation of SIEM was introduced because Big Data tools have the potential to provide significant enhancement in the action of the security intelligence by minimizing the time for correlating, consolidating, and contextualizing diverse security event information and also for correlating long-term historical data for forensic purposes.  The discussion and the analysis are limited to only four scalable and intelligent security analytics; AlienVault, QRadar, Splunk, and LogRhythm.  The Unified Security Management (USM) of AlienVault includes SIEM, vulnerability assessment, asset discovery, flow and packet capture, network and host detection, and file integrity monitoring.  The USM is utilized to improve the security visibility throughout the organization and to detect security incidents in the real-time.  IBM Security QRadar provides management for log and events, behavioral and reporting analysis for the network and applications.  Splunk Enterprise Security enables the search of the data and the implementation of visual correlation to identify malicious events and collect data about the context of those events.  LogRhythm supports log management and has the capabilities of the network forensic.  They can be deployed in smaller environments. The discussion and the analysis include the key design considerations for scalability of each tool.  The project also discusses the advantages and the disadvantages of these four intelligent security analytic tools.

Keywords: SIEM, Security Analytics Tools, QRadar, AlienVault, LogRhythm, Splunk.

Introduction

The advanced threats which often called advanced persistent threats or APTs are the primary reason which drives the organization to collect and analyze information.   The APTs are sophisticated attacks (Oprea, Li, Yen, Chin, & Alrwais, 2015), and can involve multiple events occurring across the organization which would otherwise not be connected without the utilization of advanced intelligence (SANS, 2013).  APTs cause severe risks and damages to organizations and governments because they target the confidential propriety information (SANS, 2013). 

Advanced threats require advanced intelligent and analytic tools.  Recent years have witnessed the rise of more sophisticated attacks including the APTs (IBM, 2013; Oprea et al., 2015; SANS, 2013).  In a survey conducted by (SANS, 2013), the APTs affected two-thirds of the respondents in the past two years.  The result showed that one respondent is seeing almost 500 attacks in a nine-month period, and many seeing somewhere between one and twenty.  Thus, the number of the APTs is increasing.   As indicated in (Radford, 2014) “Frequently, a victim of these attacks [APTs] do not even know that their perimeter security has been penetrated for an average of 243 days. They all have up-to-date anti-virus software, and 100% of breaches involve stolen credentials.”  The APTs is in every organization’s mind (Radford, 2014).  The Cloud Service Providers (CSP) is the prime target for cyber-attacks. Organizations who utilize the Cloud technology must consider the myriad access points to their data when hosted in a Cloud environment and should consider at length the solutions available to them, and pertinently that all data access points are covered (Radford, 2014).  The PAT is one of various security threats against which organizations must protect their information.

Various security techniques are offered to deal with security threats including the APTs.   This project discusses and analyzes four scalable and intelligent security tools from different vendors.  The analysis covers the main functions such as anomaly detection capability, event correlation capability, real-time analytics capability, and so forth of each tool.  The analysis includes an assessment if the tool is suited or used in the Cloud Computing, and an identification of the targeted applications.   The analysis also includes the pros and cons of each tool.   The project begins with an overview of Security Information and Event Management, followed by the scalable and intelligent security tools from different vendors.

Security Information and Event Management (SIEM)

The traditional and conventional model for protecting the data often focused on network-centric and perimeter security, using devices such as firewalls and intrusion detection systems (Oprea et al., 2015; Shamsolmoali & Zareapoor, 2016).  However, this conventional approach is not adequate when dealing with Big Data and Cloud Computing technologies.  The conventional approach does not provide enough protection against the advanced persistent threats (APT), privileged users or any other malicious security attacks (Oltsik, 2013; Oprea et al., 2015; Shamsolmoali & Zareapoor, 2016). 

Thus, many organizations deploy other techniques such as the database audit and protection (DAP), and security information and event management (SIEM) to collect information about the network activities (Shamsolmoali & Zareapoor, 2016).  Examples of the SIEM techniques include RSA envision and HP ArchSight using a standardized approach to collecting information and events, storing and querying and providing correlation degrees driven by rules (Pearson, 2013).   However, SIEM provides inputs which need to be properly analyzed and translated into a certain format to be utilized by senior risk evaluators and strategic policymakers. This manual process is not adequate when dealing with security issues.   Moreover, the standards of the risk assessment such as ISO2700x and NIST operate at a macro-level and usually do not fully leverage information coming from logging and auditing activities carried out by the IT operations (Pearson, 2013). Thus, SIEM lacks a solution for the business audit and strategic risk assessment (Pearson, 2013). 

In (Splunk, 2017), SIEM which is analytic-driven has six essential capabilities, (1) Real-Time Monitoring, (2) Incident Response, (3) User Monitoring, (4) Threat Intelligence, (5) Advanced Analytics, and (6) Advanced Threat Detection.  Table 1 summarizes these six essential capabilities of an analytics-driven SIEM (Splunk, 2017).

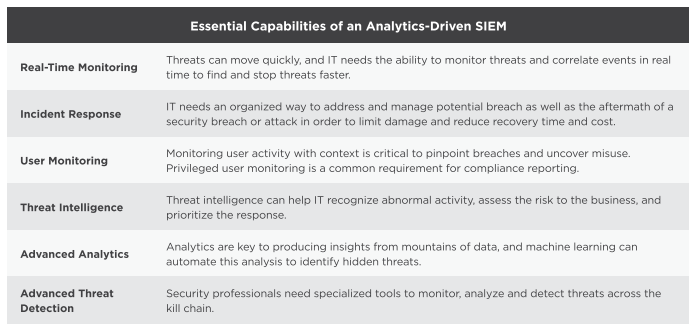
Table 1.  Six Essential Capabilities of an Analytics-Driven SIEM. Adapted from (Splunk, 2017).

      In a survey implemented by (SANS, 2013), the result showed 58% of the respondents were using dedicated log management and 37% were using a SIEM system.  The result also showed that nearly half of the respondents have dedicated log management platforms, SIEM, and scripted searches a part of their data collection and analysis processes.  The result showed that less than 10% utilizes unstructured data repositories and specific Big Data framework for analysis and search. Figure 1 illustrates the types of Security Data Analysis Tools in Use.

Figure 1. Types of Security Data Analysis Tool in Use. Adapted from (SANS, 2013).

      As indicated in (SANS, 2013), the dedicated log management platform does not meet the needs created by Big Data collection.  SIEM is anticipated to step up and meet the needs created by Big Data collection (SANS, 2013).  The survey results also showed that 26% of the respondents rely on analytics tools to do the heavy lifting of threat intelligence, and others leverage SIEM platforms and manual techniques as illustrated in Figure 2.

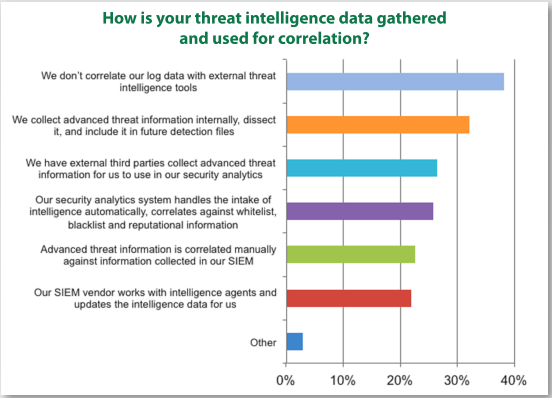
Figure 2.  Threat Intelligence Capabilities. Adapted from (SANS, 2013).

            In the same survey, the result showed that 51% of the respondents indicated they are currently using third-party intelligence services as illustrated in Figure 3.

Figure 3.  The Use of Third Party Intelligence Tools.  Adapted from (SANS, 2013).

The result of the survey also showed that the most organizations are still focused on the fundamentals such as better SIEM, more training to detect patterns of malicious activity, vulnerability management, and network protection tools, and endpoints visibility for future investments in security analytics and Big Data platform as illustrated in Figure 4.

Figure 4.  Future Investments in Analytics/Intelligence.  Adapted from (SANS, 2013).

Scalable and Intelligent Security Analytic Tools

            The management of alerts from different intrusion detection sensors and rules was a big challenge in the settings of the organizations.  The first generation of SIEM was able to aggregate and filter alarms from many sources and present actionable information to security analysis (CSA, 2013).  However, the first generation of SIEM has been overwhelmed with the volume of the data (Glick, 2014), and cannot keep up with the rate and complexity of the current wave of the cyber attacks and advanced threats (Splunk, 2017).  The second generation of SIEM was introduced because Big Data tools have the potential to provide a significant enhancement in the action of the security intelligence by minimizing the time for correlating, consolidating, and contextualizing diverse security event information, and also for correlating long-term historical data for forensic purposes (CSA, 2013).   

Most of the current SIEM systems provide the same basic features, except for those features proposed by vendors.  However, the basic feature of the SIEM systems contains Server, Database, FrontEnd, Probes, and Agents (Di Mauro & Di Sarno, 2018).  The Server is the core component of the whole deployment for collecting and processing the log coming from the external sources on behalf of the correlation engine.  The Database stores the data for analysis and runtime configuration of SIEM.  The FrontEnd is the user interface to the Server, while the Probe is the collection of sensors deployed within the monitored infrastructure.  The typical examples of the Probes include perimeter defense systems such as firewalls and intrusion prevention systems, host sensors such as Host IDSs, or security applications such as web firewalls and authentication systems (Di Mauro & Di Sarno, 2018).  The Agent represents the counterparts of probes embedded in the server and can convert heterogenous logs generated by different probes, in logs with the same syntax and a specific semantic (Di Mauro & Di Sarno, 2018).  Figure 5 illustrates the classical framework of the SIEM systems.

Figure 5.  A Classical Framework of a SIEM System.  Adapted from (Di Mauro & Di Sarno, 2018).

The security analytics market is rapidly evolving as vendors are merging, developers are adding new features, and tools once deployed exclusively on-premises which are also offered as a Cloud service (Dan Sullivan, 2015).   As indicated in (Dan Sullivan, 2015), there are three reasons for organizations to deploy security analytics software.  These reasons are the compliance, security event detection and remediation, and forensics.  The compliance is regarded to be the key driver of security requirement for more organizations.  It is imperative to verify the compliance because the government and industry regulations, organizations implement their security policies and procedures (Dan Sullivan, 2015).   The security analytics tools should alert organizations to significant events which are defined by rules such as trigger (Dan Sullivan, 2015).  The tools can help in minimizing the time and effort required to collect, filter, and analyze event data (Dan Sullivan, 2015).  The attacks can occur at high speed; these tools should also be at high speed to detect the malicious attacks.  In case the attack took place, the organization should be able to block any future attacks through the forensics, as the forensic analysis can reveal vulnerabilities in the network of the organization or desktop security controls which were not known prior the attack (Dan Sullivan, 2015). 

Thus, organizations must consider deploying security analytics software.  Various security analytics tools are introduced with the aim to detect and block any malicious attacks.  Examples of these security analytics tools include AlienVault, QRadar, Splunk, LogRhythm, FireEye, McAfee Enterprise Security Manager, and so forth.  This project discusses and analyzes four of these security analytic tools, their features, the pros, and cons. 

  1. AlienVault

AlienVault started in 2007.  During 2010 the company received an initial round of venture capital funding and relocated the headquarters from Spain to United States (Nicolett & Kavanagh, 2011).  The AlienVault’s Unified Security Management (USM) provides SIEM, vulnerability assessment, network and host intrusion detection, file integrity monitoring functions via software or appliance options (Mello, 2016; Nicolett & Kavanagh, 2011), asset discovery, and the capture of the flow and packets (Mello, 2016).  The AlienVault Unified SIEM contains the proprietary and the Open Source Security Information Management (OSSIM).  OSSIM has been available since 2003 and is an open source security management platform. AlienVault integrates OSSIM into the SIEM solution to offer enhanced performance, consolidated reporting and administration, and multi-tenanting for most managed security service providers (Nicolett & Kavanagh, 2011).    AlienVault added the real-time feature in 2010.   AlienVault’s long-term plan features to solve existing competitive gaps in areas such as application, monitoring feature for data and users, while the short-term plan includes dynamic monitor system to rule-based correlation (Nicolett & Kavanagh, 2011).

AlienVault’s USM offers three major advantages.  AlienVault offers SIEM solution, monitoring system for file integrity, assessment system for vulnerability, control for the endpoint, and intrusion detection system.   AlienVault is based on open source.  It is regarded to be less expensive than the corresponding product sets from most competitors in the SIEM domain (Nicolett & Kavanagh, 2011).  A more recent review of AlienVault Unified SIEM by (Vanhees, 2018), indicates that the AlienVault Unified Security System incorporates various technologies such as vulnerability scanning, NetFlow, host intrusion detection system, and network intrusion detection system. Moreover, it is easy to scale up and down, and it scores very high in that aspect (Vanhees, 2018). In another review by (Morrissey, 2015), AlienVault can identify risks and vulnerabilities on systems, to provide log consolidation and analysis, and to correlate threats between different systems.  As cited in (Mello, 2016), Gartner recommends AlienVault’ USM for organizations which require a broad set of integrated security capabilities, either on-premises or in AWS environment.

AlienVault has disadvantages and limitations. AlienVault lacks support for Database Activity Monitoring (DAM).  Moreover, there is no feature to integrate third-party DAM technologies (Mello, 2016; Nicolett & Kavanagh, 2011).   AlienVault lack supports the integration of Identity and Access Management (IAM) beyond Active Directory Monitoring (Mello, 2016; Nicolett & Kavanagh, 2011).   Report on AlienVault Unified Security Management by (Morrissey, 2015; Vanhees, 2018) indicates that it is not easy to develop custom plugins compared to other products, and to setup correlation rules.  Moreover, it is difficult to deal with static data as it deals only with dynamic data like syslogs, NetFlow, data captures, and so forth.  The custom reporting is very limited, and the task of creating a bar chart to visualize most common attacked ports is not possible.  Organizations which requires high-end reporting, advanced correlation rules or complex use case scenarios, should not consider AlienVault (Vanhees, 2018). 

Although AlienVault’s USM has this limitation, in a review by (Vanhees, 2018), AlienVault’s USM is described as a “huge value” as it does not require any additional setup and is baked into the tool nicely and smoothly compared with other vendors.  It helps detect suspicious traffic (Morrissey, 2015; Vanhees, 2018), and it automatically syncs with other intelligence feeds which are regarded to be handy.  The correlation rules are used to spot unwanted behavior proactively (Vanhees, 2018). 

  • QRadar

QRadar is IBM’s SIEM platform (Mello, 2016).  It is composed of QRadara Log Manager, Data Node SIEM, Risk Manager, Vulnerability Manager, QFlow, and VFlow Collectors, and Incident Forensics (Mello, 2016).  It uses the capabilities of Big Data to keep up with the advanced threats and prevent attacks before they occur (IBM, 2013).   QRadar has the capabilities to reveal hidden relationships within massive amount of security data using proven analytics to minimize billions of security events to a manageable set of prioritized incidents (IBM, 2013). 

The platform of IBM Security QRadar can be deployed as a physical or virtual or as a cloud service solution (Mello, 2016).   It can be installed using various options such as “all-in-one” implementation option or scaled.  QRadar provides capabilities such as collection and processing of the event and log data, NetFlow, deep-packet inspection of network traffic, and full-packet capture and behavior analysis (McKelvey, Curran, Gordon, Devlin, & Johnston, 2015; Mello, 2016).   IBM added more enhanced features to QRadar to support IBM X-Force Exchange for sharing threat intelligence and IBM Security App Exchange for sharing applications, and security app extensions (Mello, 2016).  After the acquisition of Resilient Systems in 2016 (Rowinski, 2016), IBM developed an integrated end-to-end security operations and response platform offering a quick response to cyber incidents.  It also enhanced the multi-tenant feature, and the capabilities of the search and system administration (Mello, 2016).

The IBM’s QRadar utilizes a distributed data management system providing horizontal scaling of data storage (D. Sullivan, 2016).  While organizations can utilize distributed USIM to access local data in some cases, they may also require searching across the distributed platform in some other scenarios.  QRadar incorporates a search engine which enables searching locally as well as across platforms (D. Sullivan, 2016).  QRadar is a big data SIEM utilizing data nodes instead of storage area network (SAN), which help in reducing the associated cost and the complexity of the management (D. Sullivan, 2016).  QRadar is a distributed storage model based on data nodes and can scale to petabytes of storage and can meet the requirement of organizations for a large volume of long-term storage (D. Sullivan, 2016).  QRadar has a vulnerability management component which is designed to integrate data from various vulnerability scanners and enhance that data with context-relevant information about network usage (D. Sullivan, 2016).   It has been used to process a large volume of events per second in real-world applications (D. Sullivan, 2016).   QRadar can be deployed in the Cloud to reduce the infrastructure management (D. Sullivan, 2016)).   The Security QRadar Risk Manager add-on offers the capability of the automated monitoring,  provides support for multiple vendor product audits, and assessment of compliance policy, and threat modeling (D. Sullivan, 2016).  QRadar platform can meet the requirement of mid-size and large organization with general SIEM needs.  It is also a good fit for mid-size organizations which require a solution with flexible implementation, hosting, and monitoring options.  QRadar is also good for organizations which look for a single security event and response platform for their security operation centers (Mello, 2016).  In recent reviews by (Verified-User2, 2017), IBM QRadar was the preferred option for the clients of the organizations across all departments for fast deployment and instant log visibility to meet security and compliance requirements. 

QRadar has various areas of strength and advantages.  It provides an integrated view of log and event data and the correlation of network traffic behavior across NetFlow and event logs.  It also supports security event and monitoring feature for the log in IaaS Cloud Service Model, including the monitoring for AWS CloudTrail and SoftLayer (Mello, 2016).   The security platform of QRadar is straightforward to implement and maintain (Mello, 2016).  In more recent reviews of IBM QRadar by (Verified-User2, 2017), IBB QRadar was described as simple, flexible framework, easy deployment and out of the box content good enough to have quick wins.  In another review by (Verified-User1, 2017), the creation of rules is intuitive and fast helping in emergency scenarios.  The maintenance of IBM QRadar is light, and the appliance has nearly flawless uptime (Verified-User1, 2017).  The generation of the reports is very functional and efficient (Verified-User1, 2017).  It was described as a positive return on investment in a recent review by (Verified-User2, 2017).  Moreover, third-party capabilities can be plugged into the framework through the Security App Exchange (Mello, 2016).  This capability of third-party support is useful because QRadar has limitation for the endpoint monitoring for threat detection and response and the integrity of the basic file (Mello, 2016). 

QRadar has additional limitations besides the endpoint monitoring.  In recent reviews by (Verified-User1, 2017), the limitations of IBM QRadar includes the steep learning curve compared to other platforms.  QRadar does require training and homework.  Moreover, there is a lack of threat feed utilization of STIX (Structured Threat Information Expression)/TAXII (Trusted Automated Exchange of Indicator Information), which remains very limited (Verified-User1, 2017).  It may require a considerable amount of tuning during the deployment with very little “out of the box” offense information (Verified-User1, 2017).  In another recent review by (Verified-User2, 2017), IBM QRadar is limited in event log parsing, and the correlation engine needs to be more flexible and dynamic (Verified-User2, 2017).

  • Splunk

The Splunk Enterprise (SE) is the core product of the company (Mello, 2016).  It provides log and event collection, searches and visualization with the query language of Splunk (Mello, 2016).  The Splunk Enterprise Security (SES) provides security features including correlation rules, reports and pre-defined dashboards (Mello, 2016).  SES supports the real-time monitoring and alerts, incident response and compliance reporting (Mello, 2016).  SE and SES can be deployed locally on-premise, or in public, private or hybrid Cloud, or as a service using the Cloud Service Models (Mello, 2016).  Splunk acquired Caspida in 2015 (Mello, 2016; Tinsley, 2015).  After the acquisition, Splunk added the native behavioral analytics to its repertoire (Mello, 2016).  Moreover, it provided support to third-party UEBA products (Mello, 2016).  Additional features have been added to SES to integrate with other behavioral products.  More capabilities such as improved incident management and workflow capabilities, lower data storage requirements, better visualizations have been implemented.  The expansion of monitoring system to additional infrastructure and software-as-a-service provider (Mello, 2016).

            Splunk has the capabilities of broad data ingestion, offering connectors to the data sources and allowing custom connectors (D. Sullivan, 2016).   Splunk systems stores data in the schema-less database and uses indexes based on ingestion enabling various data types with rapid query response (D. Sullivan, 2016).  Splunk provides flexible SIEM platform which can handle various data sources and has the analytic capabilities or a single data analysis platform (Mello, 2016).  Splunk was found gaining “significant” visibility across the client base of Gartner (Mello, 2016).  Splunk has strong advanced security analytics for combating advanced threat detection and insider threats (Mello, 2016). 

            Splunk has various advantages.  In a review by (Taitingfong, 2015), Splunk was found to be flexible and extensible.  It can ingest logs from disparate systems using disparate formats and disparate file types (Murke, 2015; Taitingfong, 2015).  Splunk was found to be flexible in parsing, formatting, and enhancing the data (Taitingfong, 2015).  Splunk was found to scale very well in large environments adding more indexers as needed with the expanded environment (Kasliwal, 2015; Murke, 2015; Taitingfong, 2015).  Splunk can do multi-site clustering and search head clustering providing load balancing and redundancy (Taitingfong, 2015).   In another review by (Murke, 2015), Splunk has the capability of the real-time analysis.   Splunk provided the best results amongst its competitors as indicated in the review of (Murke, 2015).   It provided fast results on large datasets and is easy to manage as indicated in the review by (Murke, 2015).

            Splunk system has limitations.  SES product provides only the basic pre-defined correlations for user monitoring and reporting (Mello, 2016).  The licensing model for high volume data costs more than other SIEM products, although Splunk offers a new licensing scheme for high-volume data users (Mello, 2016).  In recent reviews by (Kasliwal, 2015; Taitingfong, 2015), the search language of Splunk, the more advanced formatting or statistical analysis were found very deep and required a learning curve.  The dashboard of Splunk may require more visualization which requires development using simple XML, Java Scripts and CSS (Taitingfong, 2015).  Moreover, Splunk releases minor revisions very quickly due to the increased number of bugs (Taitingfong, 2015).  In another review by (Murke, 2015), Splunk was found limited in providing optimized results with the smaller size of data.  Moreover, it was found by (Kasliwal, 2015; Murke, 2015) as costly.

  • LogRhythm

The SIEM of the LogRhythm supports n-tier-scalable, decentralized architecture (Mello, 2016).  LogRhythm’s SIEM is composed of various tools such as Platform Manager, AI Engine, Data Processors, Data Indexers, and Data Collectors (Mello, 2016).   The deployment of LogRhythm can be consolidated as an all-in-one.  The implementation options can be appliance, software or virtual instance format (Mello, 2016).  The behavioral analytics of the user and entity, an integrated incident response workflow and automated response capabilities can be combined with other capabilities such as event, endpoint and network monitoring (Mello, 2016).   The log processing and indexing capabilities of the LogRhythm’s SIEM are divided into two components of the systems.  Moreover, more features to the system are added such as the capabilities of the unstructured search through a new storage backend based on Elasticsearch (Mello, 2016). More features are added such as the clustered full data replication; more parsers for applications and protocols, an improved risk-based prioritization (RBP), support for the Cloud services such as AWS, Box, and Okta.  The integration with the Cloud Access Security Broker solutions such as Microsoft’s Cloud App Security and Zscaler are also added to enhance the LogRhythm’s SIEM system (Mello, 2016).  

LogRhythm has various advantages.  LogRhythm can integrate the capabilities of the advanced threat monitoring with SIEM (Mello, 2016).   It offers effective out-of-the-box content and workflows which can help in the automation process (Mello, 2016).  It provides highly interactive and customizable and automated response capabilities for performing actions on remote devices (Mello, 2016). It is praised for offering straightforward SIEM systems implementation and maintenance (Mello, 2016).  LogRhythm is also described to be very visible in the SIEM evaluations of the Gartner’s clients (Mello, 2016).  In a review for LogRhythm by (Eng, 2016), it was described as a great SIEM which is easy to implement.  Building blocks using LogRhythm is intuitive and easy using drag and drop building block technique which can be easily manipulated (Eng, 2016).  It offers statistical building blocks with powerful anomaly detection capabilities which are found to be more difficult or not possible in other SIEMs products (Eng, 2016).   LogRhythm provides better event classification than any other SIEM products (Eng, 2016).   In another review by (Ilbery, 2016), LogRhythm has the capabilities to import log files from hundreds of devices into one, and it is easy to search the database (Ilbery, 2016).  It also has the capabilities to send alert messages to the network activities using emails.  It provides a good view of the network equipment, traffic, and the servers. 

            LogRhythm some limitations.  More enhancement and improvement are required for the custom report engine included (Mello, 2016).  In a review by (Eng, 2016), there is a requirement and need for LogRhythm to provide back-end support for threat intelligence lists.  There is a proposal by (Eng, 2016) for log rhythm to replace the code with hash tables to avoid the excessive cost associated with referencing lists in the rule.   The reporting of LogRhythm was described by (Eng, 2016) as the worst of all SIEM systems because it is not intuitive and needs improvement.  In another review for LogRhythm by (Ilbery, 2016),  the upgrade process was described as a not easy process.    

Conclusion

This project discussed and analyzed scalable and intelligent security analytics tools from different vendors.  The discussion began with an overview of SIEM and the essential capabilities of an analytics-driven SIEM.  The first generation of SIEM has been overwhelmed with the volume of the data and the rise of the advanced threats.  The second generation of SIEM was introduced because Big Data tools have the potential to provide significant enhancement in the action of the security intelligence by minimizing the time for correlating, consolidating, and contextualizing diverse security event information and also for correlating long-term historical data for forensic purposes.

Examples of these security analytics tools include AlienVault, QRadar, Splunk, LogRhythm, FireEye, McAfee Enterprise Security Manager, and so forth.  The discussion and the analysis were limited to only four scalable and intelligent security analytics; AlienVault, QRadar, Splunk, and LogRhythm.  The Unified Security Management (USM) of AlienVault includes SIEM, vulnerability assessment, asset discovery, flow and packet capture, network and host detection, and file integrity monitoring.  The USM is utilized to improve the security visibility throughout the organization and to detect security incidents in the real-time.  IBM Security QRadar provides management for log and events, behavioral and reporting analysis for the network and applications.  Splunk Enterprise Security enables the search of the data and the implementation of visual correlation to identify malicious events and collect data about the context of those events.  LogRhythm supports log management and has the capabilities of the network forensic.  They can be deployed in smaller environments. The discussion and the analysis included the key design considerations for scalability of each tool.  The project also discussed the advantages and the disadvantages of these four intelligent security analytic tools.

References

CSA. (2013). Expanded Top Ten Big Data Security and Privacy Challenges. Cloud Security Alliance, Big Data Working Group.

Di Mauro, M., & Di Sarno, C. (2018). Improving SIEM capabilities through an enhanced probe for encrypted Skype traffic detection. Journal of Information Security and Applications, 38, 85-95.

Eng, J. (2016). LogRhythm Review: “So you want to know which SIEM to buy”. Retrieved  from https://www.trustradius.com/reviews/logrhythm-2016-06-08-06-30-33.

Glick, B. (2014). Information Security is a Big Data Issue. Retrieved from http://www.computerweekly.com/feature/Information-security-is-a-bigdata(05.05).

IBM. (2013). Extending Security Intelligence with Big Data Solutions. Retrieved from http://www.ndm.net/siem/pdf/Extending%20security%20intelligence%20with%20big%20data%20solutions.PDF.

Ilbery, S. (2016). User Review: “LogRhythm does what it promises.”. Retrieved from https://www.trustradius.com/reviews/logrhythm-2016-06-07-13-22-49.

Kasliwal, G. (2015). Splunk Enterprise Review: “Splunk: Dynamic and Fast compliance tool”. Retrieved from https://www.trustradius.com/reviews/splunk-2015-12-07-15-43-44.

McKelvey, N., Curran, K., Gordon, B., Devlin, E., & Johnston, K. (2015). Cloud Computing and Security in the Future Guide to Security Assurance for Cloud Computing (pp. 95-108): Springer.

Mello, J. P. J. (2016). Gartner Magic Quadrant for SIEM 2016: Not just for compliance anymore. Retrieved from https://techbeacon.com/highlights-gartner-magic-quadrant-siem-2016.

Morrissey, M. (2015). AlienVault USM Review: “Making sense of the logging overload.”. Retrieved from https://www.trustradius.com/reviews/alienvault-unified-security-management-2015-09-29-23-21-40.

Murke, S. (2015). Splunk Enterprise Review: “For Real-Time Data Analyzing Get Splunk.”. Retrieved from https://www.trustradius.com/reviews/splunk-2015-12-07-23-21-33.

Nicolett, M., & Kavanagh, K. M. (2011). Magic Quadrant for Security Information and Event Management.

Oltsik, J. (2013). The Big Data Security Analytics Era Is Here.

Oprea, A., Li, Z., Yen, T.-F., Chin, S. H., & Alrwais, S. (2015). Detection of early-stage enterprise infection by mining large-scale log data. Paper presented at the Dependable Systems and Networks (DSN), 2015 45th Annual IEEE/IFIP International Conference on.

Pearson, S. (2013). Privacy, security and trust in cloud computing Privacy and Security for Cloud Computing (pp. 3-42): Springer.

Radford, C. J. (2014). Challenges and Solutions Protecting Data within Amazon Web Services. Network Security, 2014(6), 5-8. doi:10.1016/S1353-4858(14)70058-3

Rowinski, M. (2016). IBM Security Closes Acquisition of Resilient Systems. Retrieved from http://www-03.ibm.com/press/us/en/pressrelease/49472.wss, IBM News Release.

SANS. (2013). SANS Security Analytic Survey Retrieved from https://www.sans.org/reading-room/whitepapers/analyst/security-analytics-survey-34980, White Paper.

Shamsolmoali, P., & Zareapoor, M. (2016). Data Security Model In Cloud Computing. Proceedings of 2nd International Conference on Computer Science Networks and Information Technology, Held on 27th – 28th Aug 2016, in Montreal, Canada.

Splunk. (2017). The Six Essential Capabilities of an Analytics-Driven SIEM. Retrieved from https://www.splunk.com/en_us/form/the-six-essential-capabilities-of-analytics-driven-siem.html, White Paper.

Sullivan, D. (2015). Three reasons to deploy security analytics software in the enterprise. Retrieved from http://searchsecurity.techtarget.com/feature/Three-reasons-to-deploy-security-analytics-software-in-the-enterprise.

Sullivan, D. (2016). Comparing the top big data security analytics tools. Retrieved from http://searchsecurity.techtarget.com/feature/Comparing-the-top-big-data-security-analytics-tools.

Taitingfong, K. (2015). Splunk Enterprise Review: “Splunk – the most flexible SIEM tool on the market.”. Retrieved from https://www.trustradius.com/reviews/splunk-2015-12-01-16-51-52.

Tinsley, K. (2015). Splunk Acquires Caspida. Retrieved from https://www.splunk.com/en_us/newsroom/press-releases/2015/splunk-acquires-caspida.html, Splunk Press Release.

Vanhees, K. (2018). AlienVault USM Review: “Nothing is what it SIEMs”. Retrieved from https://www.trustradius.com/reviews/alienvault-unified-security-management-2015-09-29-01-55-26.

Verified-User1. (2017). IBM Security QRadar Review: “Qradar – Big League SIEM Solution”. Retrieved from https://www.trustradius.com/products/ibm-security-qradar/reviews. Verified-User2. (2017). IBM Security QRadar Review: “IBM QRadar – A go-to SIEM product”. Retrieved from https://www.trustradius.com/reviews/ibm-security-qradar-2017-06-21-04-06-13, Trust Radius Reviews.

Big Data Analytics Application to Solve Known Security Issues

Dr. Aly, O.
Computer Science

Introduction

The purpose of this discussion is to identify two advantages of applying Big Data Analytics to solve known security issues such as malware detection, network hacking, spam, and so forth.  The discussion and the analysis include the reasons and rationale for utilizing Big Data Analytics to solve security issues.  The discussion begins with a brief overview of Big Data Analytics and the Security Threats.

Big Data Analytics

Big Data (BD) is the major topic across some domains and fields such as management and marketing, scientific research, national security and government (Vivekanand & Vidyavathi, 2015).  BD enables making an informed decision as it shifts the reasoning from logical and causality-based to the acknowledgment of correlation links between events (De Mauro, Greco, & Grimaldi, 2015).   The public and private sectors are increasing their use of the Big Data Analytics (BDA) in different areas (Vivekanand & Vidyavathi, 2015).  The process of very large amounts of data is the main benefit of Big Data Analytics (Emani, Cullot, & Nicolle, 2015).  Big Data Analytics is defined in (Emani et al., 2015) as the use of advanced analytics techniques on Big Data. As elaborated by (Gupta & Jyoti, 2014), BDA is the process of analyzing Big Data to find hidden patterns, unknown correlations and other useful information which can be extracted to make a sound decision.  In (CSA, 2013), BDA is described as the process of analyzing and mining Big Data and can produce operational and business knowledge on an unprecedented scale and specificity.  The massive volume of semi-structured, unstructured data can be mined using the BDA (Gandomi & Haider, 2015; Gupta & Jyoti, 2014).  The need and the requirement to analyze and leverage trend data which are collected by organizations is one of the main drivers for BDA tools (CSA, 2013).  The value of BDA is increasing as the cash flow is increasing.  Figure 1 illustrates the graph for the value of BDA with dimensions of time and cumulative cash flow.  Thus, there is no doubt that BDA provides great benefits to organizations.  

Figure 1.  The Value of Big Data Analytics. Adapted from (Gupta & Jyoti, 2014).

Big Data Analytics for Security

BD is changing the analytics landscape (CSA, 2013).  BDA can be leveraged to enhance the information security and situational awareness (CSA, 2013).  For instance, BDA can be utilized to analyze financial transactions, log files, and network traffic to identify anomalies and suspicious activities, and to accelerate multiple sources of information into a coherent view (CSA, 2013).  The malicious attacks have been increasing lately.  Thus, the increasing security threats come along with increasing use of BD, BDA, and Cloud Computing technologies. The malicious attacks have become the major topic of government, organization, and industry (Gupta & Jyoti, 2014).  Big Data Security Analytics is used for the increasing practice of organization to gather and analyze security data to detect vulnerabilities and intrusions by attackers (Gupta & Jyoti, 2014).   The Advanced Persistent Threats (APT) is a subset of the malicious attacks and threats which are well-resourced and trained attacks which conduct multi-year intrusion campaigns targeting highly sensitive economic, proprietary or national security information (Gupta & Jyoti, 2014).  The aim APT is to maintain the persistent attack without getting detected inside their target environment (Gupta & Jyoti, 2014).

Thus, the main purpose of using BD techniques to analyze the data and apply same to implement enhanced data security techniques (Gupta & Jyoti, 2014).  Big Data technologies facilitate a wide range of industries to develop affordable infrastructures for security monitoring (Cardenas, Manadhata, & Rajan, 2013). Organizations can use various systems with a range of Security Analytics Sources (SAS).  These systems can generate messages or alerts and transmits them to the trusted server for analysis and action (Gupta & Jyoti, 2014).  The system can be Host-based Intrusion Detection System (HIDS), an antivirus engine which writes a Syslog or interfaces reporting events to remove service such as Security and Information Event Monitoring (SIEM) system (Gupta & Jyoti, 2014).  

There are very good reasons for BD to enter the security domain.  In (Gupta & Jyoti, 2014) three main reasons for BD to enter the enterprise security mainstream.  The first reason is the continuing problems with detection and response of threats because the existing security analytics tools are found inadequate to handle advanced virus, malware, stealthy attack techniques, and the growing army of well-organized global cyber attacks.  The second reason is the Moore’s Law and Open Source.  Security vendors are increasing the development cycles by customizing open source tools like Cassandra, Hadoop, MapReduce and Mahout for security analytics purposes which can help accelerate innovation to protect systems from threats.  The third reason is the tons of activity on the supply side (Gupta & Jyoti, 2014).  Organizations want security alerts from new vendors aside from HP, IBM, McAfee, and RSA Security.   Some vendors such as Hexis Cyber Solutions, Leidos, Narus, and Palantir will move beyond the government and extend into the private sector.  Others like Click Security, Forescale, and Netskope have intelligence backgrounds to deal with the malicious attacks (Gupta & Jyoti, 2014).

Fraud Detection is one of the most visible utilization of BDA (Cardenas et al., 2013; CSA, 2013).  Although Credit Card companies have conducted fraud detection for decades, the custom-built infrastructure to mine BD for fraud detection was not economical to adapt for other fraud detection uses (CSA, 2013).  The off-the-shelf BD tools and techniques are now attracting the attention to analytics for fraud detection in healthcare, insurance and other fields (CSA, 2013).  Examples of using BD for Security purposes include (1) Network Security, (2) Enterprise Event Analytics, (3) Netflow Monitoring to Identify Botnets, and (4) Advanced Persistent Threats Detection (APT).  The APT has two categories of (1) Beehive: Behavior Profiling for APT Detection, and (2) Using Large-Scale Distributed Computing to Unveil APTs.  For this discussion, the Network Security and Netflow Monitoring to Identify Botnets are the two examples for taking advantages of BDA for the security purposes (CSA, 2013).

Network Security

The case study by Zions Bancorporation is a good example for using BD for security purposes (Cardenas et al., 2013; CSA, 2013; McDaniel & Smith, 2013; Raja & Rabbani, 2014).   The traditional SIEM could not handle the volume of the data generated for security purposes (Cardenas et al., 2013; CSA, 2013; McDaniel & Smith, 2013; Raja & Rabbani, 2014).  Zions Bancorporation reported that using Hadoop clusters and business intelligence tools lead to parsing more data faster than the traditional SIEM tools (Cardenas et al., 2013; CSA, 2013; McDaniel & Smith, 2013; Raja & Rabbani, 2014).   While the traditional SIEM system takes between twenty and one hours, the Hadoop system provides the result in a minute (Cardenas et al., 2013; CSA, 2013; McDaniel & Smith, 2013; Raja & Rabbani, 2014).  The system enables users to mine meaningful security information from sources such as firewalls and security devices, website traffic, business processes and other transactions (Cardenas et al., 2013; CSA, 2013; McDaniel & Smith, 2013; Raja & Rabbani, 2014).  The incorporation of unstructured data and multiple disparate datasets into a single analytical framework is one of the main promising features of BD (CSA, 2013; Raja & Rabbani, 2014).

Netflow Monitoring to Identify Botnets

Botnets are a major threat to the current Internet (Francois, Wang, Bronzi, State, & Engel, 2011). The traffic of botnet is mixed with a large volume of benign traffic due to ubiquitous high-speed networks (Francois et al., 2011).  These networks can be monitored using IP flow records.  However, their forensic analysis forms the major computational bottleneck (Francois et al., 2011).  The BotCloud research project by (Francois et al., 2011) leveraging Hadoop and MapReduce technology is a good example of taking advantage of BDA for security purpose.  In this project of (Francois et al., 2011), a distributed computing framework leveraging a host dependency model and adapted PageRank algorithm were proposed.  Moreover, the Hadoop cluster including MapReduce was utilized to analyze and detect densely interconnected hosts which are potential botnet members.  The large volume of Netflow data collected for data analysis was the reason for using MapReduce framework (CSA, 2013; Francois et al., 2011).  The project showed a good detection accuracy and a good efficiency based on Hadoop cluster. 

Conclusion

Big Data means Big Value for organizations at various levels including the security. BD is changing the analytics landscape.  BDA can be leveraged to enhance the information security and situational awareness to detect any abnormal activities.  For instance, BDA can be utilized to analyze financial transactions, log files, and network traffic to identify anomalies and suspicious activities, and to accelerate multiple sources of information into a coherent view.  Organizations can benefit greatly from BDA tools such as Hadoop and MapReduce for security purposes.  There are various reasons for using BD and BDA for security discussed in this DB.  In this discussion, the Network Security and Netflow Monitoring to Identify Botnets are the two examples for taking advantages of BDA for the security purposes.

References

Cardenas, A. A., Manadhata, P. K., & Rajan, S. P. (2013). Big data analytics for security. IEEE Security & Privacy, 11(6), 74-76.

CSA, C. S. A. (2013). Big Data Analytics for Security Intelligence. Big Data Working Group.

De Mauro, A., Greco, M., & Grimaldi, M. (2015). What is big data? A consensual definition and a review of key research topics. Paper presented at the AIP Conference Proceedings.

Emani, C. K., Cullot, N., & Nicolle, C. (2015). Understandable big data: A survey. Computer science review, 17, 70-81.

Francois, J., Wang, S., Bronzi, W., State, R., & Engel, T. (2011). Botcloud: Detecting botnets using MapReduce. Paper presented at the Information Forensics and Security (WIFS), 2011 IEEE International Workshop on.

Gandomi, A., & Haider, M. (2015). Beyond the hype: Big data concepts, methods, and analytics. International Journal of Information Management, 35(2), 137-144.

Gupta, B., & Jyoti, K. (2014). Big data analytics with Hadoop to analyze targeted attacks on enterprise data.

McDaniel, P., & Smith, S. (2013). Big Data Analytics for Security. The University of Texas at Dallas.

Raja, M. C., & Rabbani, M. A. (2014). Big Data analytics security issues in a data-driven information system.

Vivekanand, M., & Vidyavathi, B. M. (2015). Security Challenges in Big Data: Review. International Journal of Advanced Research in Computer Science, 6(6).

Cloud Computing Security Issues

Dr. Aly, O.
Computer Science

Introduction

The purpose of this discussion is to discuss and analyze two security issues associated with the Cloud Computing system.  The analysis includes the causes for these two security issues and the solutions.  The discussion begins with an overview of the Security Issues when dealing with Cloud Computing.

Security Issues Associated with Cloud Computing

Cloud Computing and Big Data are the current buzz words in IT industry. Cloud Computing does not only solve the challenges of Big Data, but also offers benefits for businesses, organizations, and individuals such as:

  • Cost saving,
  • Access data from anywhere anytime,
  • Pay per use like any utility,
  • Data Storage,
  • Data Processing,
  • Elasticity,
  • Energy Efficiency,
  • Enhanced Productivity, and more (Botta, de Donato, Persico, & Pescapé, 2016; Carutasu, Botezatu, Botezatu, & Pirnau, 2016; El-Gazzar, 2014).

Despite the tremendous benefits of the Cloud Computing, the emerging technology of the Cloud Computing is confronted with many challenges. The top challenge is the Security, which is expressed by executives as number one concern for adopting Cloud Computing  (Avram, 2014; Awadhi, Salah, & Martin, 2013; Chaturvedi & Zarger, 2015; Hashizume, Rosado, Fernández-medina, & Fernandez, 2013; Pearson, 2013).

The security issues in Cloud Computing environment are distinguished from the security issues of the traditional distributed systems (Sakr & Gaber, 2014).   Various research studies, in an attempt, to justify this security challenge in the Cloud Computing environment, provide various reasons such as the underlying technologies of Cloud Computing have security issues, such as virtualization, and SOA (Service Oriented Architecture) (Inukollu, Arsi, & Ravuri, 2014).  Thus, the security issues that are associated with these technologies come along with the Cloud Computing (Inukollu et al., 2014).  The Cloud Computing Service Model of PaaS (Platform as a Service) is a good example because it is based on SOA (Service-Oriented Architecture) Model.  Thus, the Cloud Computing Service Model PaaS inherits all of the security issues that are associated with SOA technology (Almorsy, Grundy, & Müller, 2016).   In (Sakr & Gaber, 2014), factors such as multi-tenancy, trust asymmetry, global reach and insider threats contribute to the security issues associated with the Cloud Computing environment.  In (Tripathi & Mishra, 2011), eleven security issues and threats associated with the Cloud environment are identified (1) VM-Level attacks, (2) Abuse and Nefarious Use of Cloud Computing,  (3) Loss of Governances, (4) Lock-IN, (5) Insecure Interfaces and APIs, (6) Isolation Failure, (7) Data Loss or Leakage, (8) Account or Service Hijacking, (9) Management Interface Compromise, (10) Compliance Risks, and (11) Malicious Insiders. In the more recent report of (CSA, 2016), twelve critical issues to the Cloud security are identified and ranked in the order of severity.  Data Breaches is ranked at the top and regarded as the most severe security issue of the Cloud Computing environment.  The Weak Identity, Credential, and Access Management is the second severe security issue.  The Insecure APIs, System and Application Vulnerabilities, and Account Hijacking are the next ranked security issues.  Table 1 lists the twelve security issues associated with the Cloud Computing as reported by (CSA, 2016).

Table 1.  Top Twelve Security Issues of Cloud Computing in Order of Severity. Adapted from (CSA, 2016).

The discussion and analysis are limited to the top two security issues, which are the Data Breaches, and the Weak Identity, Credential and Access Management. The discussion and analysis cover the causes and the proposed solutions.

Data Breaches

The data breach occurs when the sensitive and confidential information or any private data not intended for the public is released, viewed, stolen or used by unauthorized users (CSA, 2016).   The data breach issue is not unique to the Cloud Computing environment (CSA, 2016).  However, it is consistently ranking as the top issue and concern for the Cloud users.  The Cloud environment is subject to the same threats as the traditional corporate network and new attack techniques due to the shared resources.  The sensitivity degree of the data determines the extent of the damage.  The impact of the Data Breach on users and organization is devastated.  For instance, in a single incident of a data breach in the USA, 40 million credit card numbers and about 70 million addresses, phone numbers and other private and personal information details were compromised (Soomro, Shah, & Ahmed, 2016).  The firm spent $61 million in less than one year of the breach for the damages and the recovery, besides the cash loss, the profit which dropped by 46% in one quarter of the year (Soomro et al., 2016).  The “BitDefender,” the anti-virus firm, and the British telecom provider “TalkTalk” are other good examples of the Data Breaches.  The private information such as username and passwords of the customers of “BitDefender” was stolen in mid-2015, and the hacker demanded a ransom of $15,000 (CSA, 2016; Fox-Brewster, 2015).  Multiple security incidents in 2014 and 2015 were reported by “TalkTalk” resulting in the theft of four million users’ private information (CSA, 2016; Gibbs, 2015). 

The organization is obliged to exercise certain security standards of care to ensure that sensitive information is not released to unauthorized users.  The Cloud providers have certain responsibilities in certain aspects of the Cloud Computing, and they usually provide the security measures for these aspects. However, the Cloud users also have certain aspects when using the Cloud Computing, and they are responsible for these aspects to protect their data in the Cloud.   The multi-factor authentication and encryptions are the two techniques that are proposed to secure the Cloud environment.  

Insufficient Identity, Credential, and Access Management

Data Breaches and the malicious attacks happen due to various reasons.  The lack of scalable Identity Access Management Systems can cause Data Breach (CSA, 2016).  The failure to use Multi-Factor Authentication, weak password use and a lack of ongoing automated rotation of cryptographic keys, passwords, and certificates can cause Data Breach (CSA, 2016).  Malicious attackers, who can masquerade as legitimate users or developers, can modify and delete data, issue control, and management functions, and snoop on data in transit or release malicious software which appears to originate from a legitimate source.   The insufficient identity, credential or key management can allow these malicious attackers or non-authorized users to access private and sensitive data and cause catastrophic damage to the users and the organizations as well.   The GitHub attack and the Dell root certificate are good examples of this security issues.  The GitHub is a good example of this security issue as the attackers scrape GitHub for Cloud service credentials, hijacked account to mine virtual currency (Sandvik 2014). Dell is another example which releases a fix for root certificate failure because all dell systems used the same secret key and the certificate which enables creating a certificate for any domain, which is trusted by Dell (Schwartz, 2015). 

The security issues require Cloud Computing systems to be protected so that unauthorized users should not have access to the private and sensitive information. Various solutions are proposed to solve this security issue of insufficient identity and access management.  A security framework in a distributed system to consider public key cryptography, software agents and XML binding technologies was proposed as indicated in (Prakash & Darbari).  The credential and cryptographic keys should not be embedded in source code or distributed in public repositories such as GitHub.  The keys should be properly secured using well-secured public key infrastructure (PKI) to ensure key-management (CSA, 2016).  The Identity Management Systems (IMS) should scale to handle the lifecycle management for millions of users and cloud service providers (CSP).  The IMS should support immediate de-provisioning of access to resources when events such as job termination or role change.   The Multi-Factor Authentication System (MAS) such as a smart card, phone authentication, should be required for user and operator of the Cloud service (CSA, 2016).  

References

Almorsy, M., Grundy, J., & Müller, I. (2016). An analysis of the cloud computing security problem. arXiv preprint arXiv:1609.01107.

Avram, M. G. (2014). Advantages and Challenges of Adopting Cloud Computing from an Enterprise Perspective. Procedia Technology, 12, 529-534. doi:10.1016/j.protcy.2013.12.525

Awadhi, E. A., Salah, K., & Martin, T. (2013, 17-20 Nov. 2013). Assessing the Security of the Cloud Environment. Paper presented at the GCC Conference and Exhibition (GCC), 2013 7th IEEE.

Botta, A., de Donato, W., Persico, V., & Pescapé, A. (2016). Integration of Cloud Computing and Internet Of Things: a Survey. Future Generation computer systems, 56, 684-700.

Carutasu, G., Botezatu, M., Botezatu, C., & Pirnau, M. (2016). Cloud Computing and Windows Azure.

Chaturvedi, D. A., & Zarger, S. A. (2015). A review of security models in cloud computing and an Innovative approach. International Journal of Computer Trends and Technology (IJCTT), 30(2), 87-92.

CSA. (2016). The Treacherous 12: Cloud Computing Top Threats in 2016. Cloud Security Alliance

Top Threats Working Group.

El-Gazzar, R. F. (2014). A literature review on cloud computing adoption issues in enterprises. Paper presented at the International Working Conference on Transfer and Diffusion of IT.

Fox-Brewster, T. (2015). Anti-Virus Firm BitDefender Admits Breach, Hacker Claims Stolen Passwords Are Unencrypted. Retrieved from https://www.forbes.com/sites/thomasbrewster/2015/07/31/bitdefender-hacked/#5a5f5b125ab2.

Gibbs, S. (2015). TalkTalk criticised for poor security and handling of hack attack. Retrieved from http://www.theguardian.com/technology/2015/oct/23/talktalk-criticised-for-poor-security-and-handling-of-hack-attack.

Hashizume, K., Rosado, D. G., Fernández-medina, E., & Fernandez, E. B. (2013). An analysis of security issues for cloud computing. Journal of internet services and applications, 4(1), 1-13. doi:10.1186/1869-0238-4-5

Inukollu, V. N., Arsi, S., & Ravuri, S. R. (2014). Security issues associated with big data in cloud computing. International Journal of Network Security & Its Applications, 6(3), 45.

Pearson, S. (2013). Privacy, security and trust in cloud computing Privacy and Security for Cloud Computing (pp. 3-42): Springer.

Prakash, V., & Darbari, M. A Review on Security Issues in Distributed Systems.

Sakr, S., & Gaber, M. (2014). Large Scale and big data: Processing and Management: CRC Press.

Sandvik , R. A. (2014). Attackers Scrape GitHub for Cloud Service Credentials, Hijack Account to Mine Virtual Currency. Retrieved from https://www.forbes.com/sites/runasandvik/2014/01/14/attackers-scrape-github-for-cloud-service-credentials-hijack-account-to-mine-virtual-currency/#71fe913c3196.

Schwartz, M. (2015). Dell Releases Fix for Root Certificate Fail. Retreived from http://www.bankinfosecurity.com/dell-releases-fix-for-root-certificate-fail-a-8701/op-1.

Soomro, Z. A., Shah, M. H., & Ahmed, J. (2016). Information security management needs more holistic approach: A literature review. International Journal of Information Management, 36(2), 215-225.

Tripathi, A., & Mishra, A. (2011, 14-16 Sept. 2011). Cloud computing security considerations. Paper presented at the 2011 IEEE International Conference on Signal Processing, Communications and Computing (ICSPCC).

Big Data Security Issues

Dr. Aly, O.
Computer Science

Introduction

The purpose of this discussion is to discuss and analyze two security issues associated with Big Data.  The analysis includes the causes for these two security issues and the solutions.  The discussion begins with an overview of the Security Issues when dealing with Big Data.

Security Issues Associated with Big Data

As indicated in (CSA & Big-Data-Working-Group, 2013), the velocity, volume and variety characteristics of Big Data magnify the security and privacy issues.  These security and privacy issues include issues such as the large-scale infrastructures in the Cloud, various data sources and formats, the acquisition of the data using streaming techniques, and the high-volume migration inside the Cloud (CSA & Big-Data-Working-Group, 2013).  Thus, the traditional security techniques which tended to be for small-scale, static data are found inadequate when dealing with Big Data (CSA & Big-Data-Working-Group, 2013).  Storing the organizations’ information, customers and patients in a secure manner is not a trivial process, and it gets more complicated in a Big Data environment (Al-Kahtani, 2017).   CSA identified the top ten Big Data Security and Privacy challenges illustrated in the Big Data Ecosystem in Figure 1, adapted from CSA.  These ten security challenges are categorized in four main categories in Big Data Ecosystems: (1) The infrastructure Security, (2) Data Privacy, (3) Data Management, and (4) Integrity and Reactive Security.

Figure 1.  Top Ten Security Challenges in Big Data Ecosystem, adapted from (Al-Kahtani, 2017).

Tremendous efforts from the researchers, practitioners and the industry are exerted to address the security issues associated with Big Data.  As indicated in (Arora & Bahuguna), Security of the Big Data is challenging due to two main vulnerabilities.  The first vulnerability includes the information leakage which gets increased by Big Data because of its characteristics of high volume and velocity (Arora & Bahuguna).  The second vulnerability reflects the privacy and prediction of people’s behavior risk get increased by the development of intelligent terminals (Arora & Bahuguna).  In (Al-Kahtani, 2017), the general security risks associated with Big Data environments are identified to include six security risk elements. The first security risk is associated with the implementation of a new technology, which can lead to new vulnerability discovery. The second security risk can be associated with the open source tools which can contain undocumented vulnerabilities and lack of update options such as backdoors.  The third security risk reflects the large cluster node attack surfaces which organizations are not prepared to monitor them.  The fourth security risk reflects the poor authentication of users and the weak remote access policies. The fifth security risk is associated with the organizations is unable to handle large processing of audit and access logs.  The sixth element includes the lack of data validation looking for malicious data input which can become lost in the large volume of the Big Data (Al-Kahtani, 2017).  With regard to the infrastructure, the common attacks can include false data injections, Denial of Service (DoS), worm and malware propagation, and botnet attacks (Al-Kahtani, 2017).   In (Khan et al., 2014), the security issues associated with the Big Data are categorized into privacy, integrity, availability, confidentiality, and governance.  Data leakage is a major privacy concern in Big Data.  The data integrity is a particular challenge for large-scale collaborative analysis, where data frequently changes (Khan et al., 2014).  The availability is critical when dealing with Big Data in the cloud.  It involves threats to data availability such as Denial of Service (DoS) and Mitigation of DoS attacks.  The confidentiality security issue refers to the distorted data from theft (Khan et al., 2014).  In (Mehta, 2017), the security issues associated with Big Date involves granular access, monitoring in real-time, granular audits, preserve privacy in data mining and analytics, encrypted data-centric security, data provenance and verification, and integrity and reactive security.  These security issues are similar to the ones discussed in (CSA & Big-Data-Working-Group, 2013; Sahafizadeh & Nematbakhsh, 2015; Yadav, 2016).

For this discussion, only two security issues associated with Big Data are discussed and analyzed with the proposed solutions to overcome them.  These two security issues are categorized under the Integrity and Reactive Security category of (CSA & Big-Data-Working-Group, 2013), which involves (1) End-point validation and filtering, and (2) Real-time Security Monitoring.  The End-point validation and filtering are categorized in (Demchenko, Ngo, de Laat, Membrey, & Gordijenko, 2013-15) under the Infrastructure Security category, while the Real-time Security Monitoring is categorized under the Data Management. 

End-Point Validation and Filtering Security Issue and Proposed Solutions

The end-points are the main components for Big Data collection (Yadav, 2016).  They provide input data for storage and processing.  Security is very important to ensure the use of the only authentic end-points, where the network is free from other end-points including the malicious ones (Yadav, 2016).   The data collected from various sources including end-point devices is required when dealing with Bid Data (CSA & Big-Data-Working-Group, 2013). The security information and event management system (SIEM) is an example of collecting logs from millions of software applications and hardware devices in an enterprise or organization network.  The input validation and filtering process during this data collection are very challenging and critical to the integrity and the trust of the data due to threats of the untrusted sources especially with the “bring-your-own-device” (BYOD) model which allows employees to bring their own devices to the workplace (CSA & Big-Data-Working-Group, 2013).  There are four threat models when dealing with validation and filtering security issue.  The malicious attacker may tamper with any of these devices such as the smartphone from where data is collected and retrieved with the aim of providing malicious input to a central data collection system is the first threat model.  The malicious attacker may perform ID cloning attacks such as Sybil attacks on the collected data with the aim of providing malicious input to a central data collection using the faked identities.  The malicious attacker can manipulate the input sources of sensed data is the third threat model when dealing with the validation and filtering security issue.  The last threat model for this security issue involves the malicious attacker compromising data in transmission from a benign source to the central collection system such as by performing a man-in-the-middle attack or a replay attack (CSA & Big-Data-Working-Group, 2013).

A use case scenario for this issue is the data which gets retrieved from weather sensors and feedback votes and are sent by a smartphone such as iPhone or Android applications have the similar validation and filtering problem (CSA & Big-Data-Working-Group, 2013).  The security issue of the validation and filtering of this example gets further complicated when the volume of the data collected gets increased (CSA & Big-Data-Working-Group, 2013).  The algorithm is required to validate the input for large data sets to validate and filter the data from any malicious and untrusting data (CSA & Big-Data-Working-Group, 2013). 

The solutions to the validation security issue are categorized into two categories.  The first category is to prevent the malicious attacker from generating and sending malicious input to the central collection system (CSA & Big-Data-Working-Group, 2013).  The second category is to detect and filter malicious input at the central system in case the malicious attacker was successful sending the malicious data to the central collection system (CSA & Big-Data-Working-Group, 2013).  

The first solution to prevent malicious attacks requires tamper-proof software and defense against the “Sybil” attacks.   The researchers and industry have exerted tremendous efforts to design and implement tamper-proof secure software and tools.  The security for PC-based platforms and applications have been widely studied.  However, the mobile devices and the application security still an active area for research (CSA & Big-Data-Working-Group, 2013).  Thus, the determined malicious attacker may succeed in tamping the mobile devices.  Trusted Platform Module (TPM) was proposed to ensure the integrity of raw sensor data, and data derived from raw data (CSA & Big-Data-Working-Group, 2013).  However, the TPM solution is not found in mobile devices universally.  Thus, the malicious attacker can manipulate the sensor input such as GPS signals (CSA & Big-Data-Working-Group, 2013).  Various defense techniques against the fake ID using the ID cloning attacks and Sybil attacks have been proposed such as P2P (Peer-To-Peer) systems, Recommender Systems (RS), Vehicular Networks, and Wireless Sensor Network (CSA & Big-Data-Working-Group, 2013).  Many of these defense techniques propose the Trusted Certificates and Trusted Devices to prevent Sybil attacks.  However, in large enterprise settings and organizations with millions of entities, the management of certificates become an additional challenge.  Thus, additional solutions for resource testing are proposed to provide minimal defense against the Sybil attacks by discouraging Sybil attacks instead of preventing it (CSA & Big-Data-Working-Group, 2013).   The Big Data analytical techniques can be used to detect and filter malicious input at the central collection system.  Malicious input from the malicious attacker may appear as outliers.  Thus, statistical analysis and outlier detection techniques can be used to detect and filter out the malicious output (CSA & Big-Data-Working-Group, 2013).

Real-time Security Monitoring

The Real-Time Security Monitoring is described as one of the most challenging Big Data Analytics issues (CSA & Big-Data-Working-Group, 2013; Sakr & Gaber, 2014).  This challenging issue is a two-dimensional issue including the monitoring of the Big Data infrastructure itself, and the use of the same infrastructure for Big Data Analytics.  The performance monitoring and the health of the nodes in the Big Data infrastructure is an example of the first side of this issue. A good example of the other side of this issue is the health care provider using monitoring tools to look for fraudulent claims to get a better real-time alert and compliance monitoring (CSA & Big-Data-Working-Group, 2013).   The Real-Time Security Monitoring is challenging because the security devices send some alerts which can lead to a massive number of false positives, which are often ignored due to the limited human capacity for analysis.  This problem becomes further challenging with Big Data due to the characteristics of the Big Data volume, the velocity of the data streams.   However, the technologies of the Big Data can provide an opportunity to process and analyze different types of data rapidly, and real-time anomaly detection based on scalable security analytics (CSA & Big-Data-Working-Group, 2013). 

A use case scenario for this issue is the health industry by reducing the fraud related to claims (CSA & Big-Data-Working-Group, 2013).  Moreover, the stored data are extremely sensitive and must comply with the patient privacy regulations such as HIPAA, and it must be carefully protected.   The Real-Time detection of the anomalous retrieval of private information of the patients enables the healthcare provider to rapidly repair damage and prevent further misuse (CSA & Big-Data-Working-Group, 2013).

The security of the Big Data infrastructure and platform must be secured which is a requirement for the Real-Time Security Monitoring.  Big Data infrastructure threats include (1) rogue admin access to applications or nodes, (2) web application threats, and (3) eavesdropping on the line.  Thus, the security of Big Data ecosystem and infrastructure must include each component and the integration of these components.  For instance, when using Hadoop cluster in a Public Cloud, the security for the Big Data should include the Security of the Public Cloud, the Security of Hadoop clusters and all nodes in the cluster, the Security of the Monitoring Applications, and the Security of the Input Sources such as devices and sensors (CSA & Big-Data-Working-Group, 2013).  The threats also include the attack on the Big Data Analytics tools which are used to identify the malicious attacks.  For instance, evasion attacks can be used to prevent from being detected; the data poisoning attacks can be used to minimize the trustworthiness and integrity of the datasets which are used to train Big Data analytics algorithms (CSA & Big-Data-Working-Group, 2013).  Moreover, barriers such as legal regulations become important when dealing with the Real-Time Security Monitoring challenges of the Big Data.  Big Data Analytics (BDA) can be employed to monitor anomalous connection to the cluster environment and to mine the logging events to identify any suspicious activities (CSA & Big-Data-Working-Group, 2013).  When dealing with the Real-Time Security Monitoring, various factors such as technical, legal and ethical must be taken into consideration (CSA & Big-Data-Working-Group, 2013).

Conclusion

This discussion focused on two security issues associated with Big Data.  The discussion and the analysis included the cause of these two security issues and the solutions.  The discussion began with an overview of the Security Issues when dealing with Big Data.  The categories of the threats are described not only by (CSA & Big-Data-Working-Group, 2013) but also by researchers.  CSA identified the top ten challenges when dealing with Big Data.  Various researchers also identified the threats and security challenges associated with Big Data.  Some of these security challenges and threats include the secure computations in distributed programming framework. The security of data storage and transactions logs, the End-Point input validation and filtering, and Real-Time Security Monitoring.  The two security issues chosen for this discussion are the End-Point input validation and filtering, and the Real-Time Security Monitoring.   Various solutions are proposed to reduce and prevent the attacks and threats when dealing with Big Data. However, there is no perfect solution yet for the threats and security issues associated with Big Data due to the nature of the Big Data and the fact that the mobile devices are still active research areas for security. 

References

Al-Kahtani, M. S. (2017). Security and Privacy in Big Data. International Journal of Computer Engineering and Information Technology, 9(2).

Arora, M., & Bahuguna, H. Big Data Security–The Big Challenge.

CSA, & Big-Data-Working-Group. (2013). Expanded Top Ten Big Data Security and Privacy Challenges. Cloud Security Alliance.

Demchenko, Y., Ngo, C., de Laat, C., Membrey, P., & Gordijenko, D. (2013-15). Big security for big data: addressing security challenges for the big data infrastructure. Paper presented at the Workshop on Secure Data Management.

Khan, N., Yaqoob, I., Hashem, I. A. T., Inayat, Z., Mahmoud Ali, W. K., Alam, M., . . . Gani, A. (2014). Big Data: Survey, Technologies, Opportunities, and Challenges. The Scientific World Journal, 2014.

Mehta, T. M. P. M. P. (2017). Security and Privacy–A Big Concern in Big Data A Case Study on Tracking and Monitoring System.

Sahafizadeh, E., & Nematbakhsh, M. A. (2015). A Survey on Security Issues in Big Data and NoSQL. Int’l J. Advances in Computer Science, 4(4), 2322-5157.

Sakr, S., & Gaber, M. (2014). Large Scale and big data: Processing and Management: CRC Press.

Yadav, N. (2016). Top Ten Big Data Security and Privacy Challenge. Retrieved from https://www.infosecurity-magazine.com/opinions/big-data-security-privacy/.

Advanced Processing Techniques for Big Data

Dr. Aly, O.
Computer Science

Abstract

The purpose of this project is to discuss and analyze advanced processing techniques for Big Data.  There are various processing systems such as Iterative Processing, Graph Processing, Stream Processing also known as Event Processing or Real-Time Processing, and Batch Processing.    A MapReduce-based framework such as Hadoop supports the Batch-Oriented Processing.  MapReduce lacks the built-in support for the Iterative Processing which requires parsing datasets iteratively, large Graph Processing, and Stream Processing.  Thus, various models such as Twister, and iMapReduce are introduced to improve the Iterative Processing of the MapReduce, and Surfer, Apache Hama, Pregel, GraphLab for large Graph Processing.  Other models are also introduced to support the Stream Processing such as Aurora, Borealis, and IBM InfoSphere Streams.  This project focuses the discussion and the analysis of the Stream Processing models of Aurora and Borealis.  The discussion and the analysis of Aurora model includes an overview of the Aurora model as Streaming Processing Engine (SPE), followed by the Aurora Framework and the fundamental components of the Aurora topology.  The Query Model of Aurora, which is known as Stream Query Algebra “SQuAI,” supports seven operators constructing the Aurora network and queries for expressing its stream processing requirements.   The discussion and analysis also include the SQuAl and the Query Model, the Run-Time Framework and the Optimization systems to overcome bottlenecks at the network.  The Aurora* and Medusa as Distributed Stream Processing are also discussed and analyzed.  The second SPE is Borealis which is a Distributed SPE.  The discussion and the analysis of the Borealis involved the framework, the query model, and the optimization techniques to overcome bottlenecks at the network.  A comparison between Aurora and Borealis is also discussed and analyzed. 

Keywords: Stream Processing, Event Processing, Aurora, Borealis.

Introduction

            When dealing with Big Data, its different characteristics and attributes such as volume, velocity, variety, veracity, and value must be taken into consideration (Chandarana & Vijayalakshmi, 2014).   Thus, different types of the framework are required to run different types of analytics (Chandarana & Vijayalakshmi, 2014).  The workload of the large-scale data processing has different types of workloads (Chandarana & Vijayalakshmi, 2014).   Organizations deploy a combination of different types of workloads to achieve the business goal (Chandarana & Vijayalakshmi, 2014).  These various types of workloads involve Batch-Oriented Processing, Online-Transaction Processing, Stream Processing, Interactive ad-hoc Query and Analysis (Chandarana & Vijayalakshmi, 2014), and Online Analytical Processing (Erl, Khattak, & Buhler, 2016). 

For the Batch-Oriented Processing, a MapReduce-based framework such as Hadoop can be deployed for recurring tasks such as large-scale Data Mining or Aggregation (Chandarana & Vijayalakshmi, 2014; Erl et al., 2016; Sakr & Gaber, 2014).  For the OLTP such as user-facing e-commerce transactions, the Apache HBase can be deployed (Chandarana & Vijayalakshmi, 2014).  The OLTP system processes transaction-oriented data (Erl et al., 2016).  For the Stream Processing, Storm framework can be deployed to handle stream sources such as social media feeds or sensor data (Chandarana & Vijayalakshmi, 2014).  For the Interactive ad-hoc Query and Analysis, the Apache Drill framework can be deployed (Chandarana & Vijayalakshmi, 2014).  For the OLAP, which form an integral part of Business Intelligence, Data Mining, and Machine Learning, the systems are used for processing data analysis queries (Erl et al., 2016).   

Apache Hadoop framework allows distributed processing for large data sets across clusters of computers using simple programming models (Chandarana & Vijayalakshmi, 2014).   The Apache Hadoop framework involves four major modules; Hadoop Core, Hadoop Distributed Files System (HDFS), Hadoop YARN, and Hadoop Map Reduce.  The Hadoop Core is used as the common utilities which support other modules.  The HDFS module provides high throughput access to application data.  The Hadoop YARN module is for job scheduling and resource management.  The Hadoop MapReduce is for parallel processing of large-scale dataset (Chandarana & Vijayalakshmi, 2014).   

Moreover, there are various processing systems such as Iterative Processing (Schwarzkopf, Murray, & Hand, 2012), Graph Processing, and Stream Processing (Sakr & Gaber, 2014; Schwarzkopf et al., 2012).  The Iterative Processing systems utilize the in-memory caching (Schwarzkopf et al., 2012).   Many data analysis application requires the iterative processing of the data which includes algorithms for text-based search and machine learning.  However, because MapReduce lacks the built-in support for iterative processing which requires parsing datasets iteratively (Zhang, Chen, Wang, & Yu, 2015; Zhang, Gao, Gao, & Wang, 2012), various models such as Twister, HaLoop, and iMapReduce are introduced to improve the iterative processing of the MapReduce (Zhang et al., 2015).   With regard to the Graph Processing, MapReduce is suitable for processing flat data structures, such as vertex-oriented tasks and propagation is optimized for edge-oriented tasks on partitioned graphs. However, to improve the programming models for large graph processing, various models such as Surfer (Chen, Weng, He, & Yang, 2010; Chen et al., 2012), GraphX (Gonzalez et al., 2014), Apache Hama, GoldenOrb, Giraph, Phoebus, GPS (Cui, Mei, & Ooi, 2014), Pregel (Cui et al., 2014; Hu, Wen, Chua, & Li, 2014; Sakr & Gaber, 2014), and GraphLab (Cui et al., 2014; Hu et al., 2014; Sakr & Gaber, 2014).  With regard to the Steam Processing, because MapReduce is design for Batch-Oriented Computation such as log analysis and text processing (Chandarana & Vijayalakshmi, 2014; Cui et al., 2014; Erl et al., 2016; Sakr & Gaber, 2014; Zhang et al., 2015; Zhang et al., 2012), and is not adequate for supporting real-time stream processing tasks (Sakr & Gaber, 2014) various Steam Processing models are introduced such as DEDUCE, Aurora, Borealis, IBM Spade, StreamCloud, Stormy (Sakr & Gaber, 2014), Twitter Storm (Grolinger et al., 2014; Sakr & Gaber, 2014), Spark Streaming, Apache Storm (Fernández et al., 2014; Gupta, Gupta, & Mohania, 2012; Hu et al., 2014; Scott, 2015), StreamMapReduce (Grolinger et al., 2014), Simple Scalable Streaming System (S4) (Fernández et al., 2014; Grolinger et al., 2014; Gupta et al., 2012; Hu et al., 2014; Neumeyer, Robbins, Nair, & Kesari, 2010-639), and IBM InfoSphere Streams (Gupta et al., 2012).

            The project focuses on two models of the Stream Processing.  The discussion and the analysis will be on Aurora stream processing systems and Borealis stream processing systems.  The discussion and the analysis will also address their characteristics, architectures, performance optimization capability, and scalability.  The project will also discuss and analyze the performance bottlenecks, the cause of such bottlenecks and the strategies to remove these bottlenecks.  The project begins with a general discussion on the Stream Processing.

Stream Processing Engines

            Stream Processing is defined by (Manyika et al., 2011) as technologies designed to process large real-time streams of event data.  The Stream Processing allows applications such as algorithms trading in financial services, RFID even processing applications, fraud detection (Manyika et al., 2011; Scott, 2015), process monitoring, and location-based services in telecommunications (Manyika et al., 2011).  Stream Processing reflects the Real-Time Streaming, and also known as “Event Stream Processing” (Manyika et al., 2011).   The “Event Stream Processing” is also known as “Streaming Analytics” which is used to process customer-centric data “on the fly” without the need for long-term storage (Spiess, T’Joens, Dragnea, Spencer, & Philippart, 2014).

            In the Real-Time mode, the data is processed in-memory because it is captured before it gets persisted to the disk (Erl et al., 2016).  The response time ranges from a sub-second to under a minute (Erl et al., 2016).  The Real-Time mode reflects the velocity feature and characteristics of Big Data datasets (Erl et al., 2016).  When Big Data is processed using the Real-Time or Even Stream Processing, the data arrives continuously in a stream, or at an interval in events (Erl et al., 2016).  The individual data for streaming is small. However, the continuous nature leads to such streamed data result in very large datasets (Erl et al., 2016; Gradvohl, Senger, Arantes, & Sens, 2014).   Real-Time mode also involves “Interactive Mode” (Erl et al., 2016). The “Interactive Mode” refers to the Query Processing in the Real-Time (Erl et al., 2016). 

            The systems of the Event Stream Processing (ESP) are designed to provide high-performance analysis of streams with low latency (Gradvohl et al., 2014).  The first Event Stream Processing (ESP) systems, which were developed in the early 2000s, include Aurora, Borealis, STREAM, TelegraphCQ, NiagaraCQ, and Cougar (Gradvohl et al., 2014).  During that time, the systems were centralized systems namely running on a single server aiming to overcome the issues of stream processing by the traditional database (Gradvohl et al., 2014).   Tremendous efforts have been exerted to enhance and improve the data stream processing from centralized stream processing systems to stream processing engines with the ability to distribute queries among a cluster of nodes (Sakr & Gaber, 2014).  This next discussion will focus on two of the scalable processing of streaming data; Aurora and Borealis. 

  1. Aurora Streaming Processing Engine

Aurora was introduced through a project effort from Brandeis University, Brown University, and MIT (Abadi et al., 2003; Sakr & Gaber, 2014).   The prototype of Aurora implementation was introduced in 2003 (Abadi et al., 2003; Sakr & Gaber, 2014).  The GUI interface of Aurora is based on Java allowing construction and execution of Aurora networks, which supports the construction of arbitrary Aurora networks and query (Abadi et al., 2003; Sakr & Gaber, 2014).  The Aurora system is described as a processing model to manage data streams for monitoring applications, which are distinguished substantially from the traditional business data processing (Abadi et al., 2003; Sakr & Gaber, 2014).   The main aim of the monitoring applications is to monitor continuous streams of data (Abadi et al., 2003; Sakr & Gaber, 2014).  As an example of these Monitoring, Applications is the military applications which monitor readings from sensors worn by soldiers such as blood pressure, heart rate, position, and so forth.  Another example of these Monitoring Applications includes the financial analysis applications which monitor the stock data streams reported from various stock exchanges (Abadi et al., 2003; Sakr & Gaber, 2014).  The Tracking Applications which monitor the location of large numbers of the object are other types of Monitoring Applications (Abadi et al., 2003; Sakr & Gaber, 2014). 

Due to the nature of the Monitoring Applications, they can benefit from the Database Management System (DBMS) because of the high volume of monitored data and the requirement of the query for these applications (Abadi et al., 2003; Sakr & Gaber, 2014).  However, the existing DBMS systems are unable to fully support such applications because DBMS systems target Business Applications and not Monitoring Applications (Abadi et al., 2003; Sakr & Gaber, 2014).  DBMS gets its data from humans issuing transactions, while the Monitoring Applications get their data from external sources such as sources (Abadi et al., 2003; Sakr & Gaber, 2014).  The role of DBMS when supporting the Monitoring Applications is to detect and alert humans of any abnormal activities (Abadi et al., 2003; Sakr & Gaber, 2014).  This model is described as DBMS-Active, Human-Passive (DAHP) Model (Abadi et al., 2003; Sakr & Gaber, 2014).  This model is different from the traditional DBMS model which is described as Human-Active, DBMS-Passive (HADP) Model, where humans initiate queries and transactions on the DBMS passive repository (Abadi et al., 2003; Sakr & Gaber, 2014).

Besides, the Monitoring Applications require not only the latest value of the object but also the historical values (Abadi et al., 2003; Sakr & Gaber, 2014).   The Monitoring Applications are trigger-oriented applications to send the alert message when abnormal activities are detected (Abadi et al., 2003; Sakr & Gaber, 2014).  Besides, the Monitoring Applications requires approximate answers due to the nature of the data stream processing where data can get lost or omit for processing reasons.  The last characteristic of the Monitoring Applications involves the Real-Time requirement and the Quality-of-Service (QoS).  Table 1 summarizes these five major characteristics of the Monitoring Applications, for which Aurora systems are designed to manage data streams.

Table 1: Monitoring Applications Characteristics.

1.1 Aurora Framework

The traditional DBM could not be used to implement these Monitoring Applications with these challenging characteristics (Abadi et al., 2003; Carney et al., 2002; Cherniack et al., 2003; Sakr & Gaber, 2014).  The prevalent requirements of these Monitoring Applications are the data and information streams, triggers, imprecise data, and real-time (Abadi et al., 2003; Carney et al., 2002; Cherniack et al., 2003; Sakr & Gaber, 2014).  Thus, Aurora systems are designed to support these Monitoring Applications with these challenging characteristics and requirements (Abadi et al., 2003; Carney et al., 2002; Cherniack et al., 2003; Sakr & Gaber, 2014).  The underlying concept of the Aurora System Model is to process the incoming data streams as an application administrator and use boxes and arrows paradigm as a data-flow system, where the tuples flow through a loop-free, directed graph of processing operations (Abadi et al., 2003; Carney et al., 2002; Cherniack et al., 2003; Sakr & Gaber, 2014).  The output streams are presented to applications which get programmed to deal with the asynchronous tuples in an output stream (Abadi et al., 2003; Sakr & Gaber, 2014).   The Aurora System Model also maintains historical storage to support ad-hoc queries (Abadi et al., 2003; Sakr & Gaber, 2014).  The Aurora systems handle data from a variety of sources such as computer programs which generate values at regular or irregular intervals or hardware sensors (Abadi et al., 2003; Carney et al., 2002; Cherniack et al., 2003; Sakr & Gaber, 2014).  Figure 1 illustrates the Aurora System Model reflecting the input data stream, the operator boxes, the continuous and ad-hoc queries, and the output to applications.  

Figure 1:  Overview of Aurora System Model and Architecture.  Adapted from (Abadi et al., 2003; Carney et al., 2002; Cherniack et al., 2003; Sakr & Gaber, 2014).

1.2  Aurora Query Model: SQuAl Using Seven Primitive Operations

            The Aurora Stream Query Algebra (SQuAl) supports seven operators which are used to construct Aurora networks and queries for expressing its stream processing requirements (Abadi et al., 2003; Sakr & Gaber, 2014).  Many of these operations have analogs in the relational query operation.  For instance, the “filter” operator in Aurora Query Algebra, which applies any number of predicates to each incoming tuple, routing the tuples based on the satisfied predicates, is like the relational operator “select” (Abadi et al., 2003; Sakr & Gaber, 2014).   The “aggregate” operators in Aurora Query Algebra computes stream aggregation to address the fundamental push-based nature of data streams, applying a function such as a moving average across a window of values in a stream (Abadi et al., 2003; Sakr & Gaber, 2014).  The windowed operations are required when the data is stale or time imprecise (Abadi et al., 2003; Sakr & Gaber, 2014).  The application administrator in the Aurora System Model can connect the output of one box to the input of several others which implements the “implicit split” operations rather than the “explicit split” of the relational operations (Abadi et al., 2003; Sakr & Gaber, 2014).  Besides, the Aurora System Model contains an “explicit union” operation where two streams can be put together (Abadi et al., 2003; Sakr & Gaber, 2014).   The Aurora System Model also represents a collection of streams with a common schema, called “Arcs” (Abadi et al., 2003; Sakr & Gaber, 2014).   The Arc does not have any specific number of streams which makes it easier to have streams come and goes without any modifications to the Aurora network (Abadi et al., 2003; Sakr & Gaber, 2014).

            In Aurora Query Model, the stream is an append-only sequence of tuples with uniform schema, where each tuple in a stream has a timestamp for QoS calculations (Abadi et al., 2003; Sakr & Gaber, 2014).  When using Aurora Query Model, there is no arrival order assumed which help in gaining latitude for producing outputs out of order for serving high-priority tuples first (Abadi et al., 2003; Sakr & Gaber, 2014).   Moreover, this no arrival order assumption also helps in redefining the windows for attributes, and in merging multiple streams (Abadi et al., 2003; Sakr & Gaber, 2014).   Some operators are described as “order-agnostic” such as such as Filter, Map, and Union.  Some other operators are described as “order-sensitive” such as BSort, Aggregate, Join, and Resample where they can only be guaranteed to execute with finite buffer space and in a finite time if they can assume some ordering over their input streams (Abadi et al., 2003; Sakr & Gaber, 2014).  Thus, the order-sensitive operators require order specification arguments which indicate the arrival order of the expected tuple (Abadi et al., 2003; Sakr & Gaber, 2014).   

            The Aurora Query Model supports three main operations modes: (1) the continuous queries of the real-time processing, (2) the views, and (2) the ad-hoc queries (Abadi et al., 2003; Sakr & Gaber, 2014).  These three operations modes utilize the same conceptual building blocks technique processing flows based on QoS specifications (Abadi et al., 2003; Sakr & Gaber, 2014).  In Aurora Query Model, each output is associated with two-dimensional QoS graphs which specify the utility of the output with regard to several performance-related and quality-related attributes (Abadi et al., 2003; Sakr & Gaber, 2014).   The stream-oriented operators which constitute the Aurora network and queries are designed to operate in a data flow mode where data elements are processed as they appear on the input (Abadi et al., 2003; Sakr & Gaber, 2014).

1.3 Aurora Run-Time Framework and Optimization

The main purpose of the Aurora run-time operations is to process data flows through a potentially large workflow diagram (Abadi et al., 2003; Sakr & Gaber, 2014).  The Aurora Run-Time Architecture involves five main techniques: (1) the QoS data structure, (2) the Aurora Storage Management (ASM), (3) the Run-Time Scheduling (RTS), (4) the Introspection, and (5) the Load Shedding.   

The QoS is a multi-dimensional function which involves response times, tuple drops, and values produced (Abadi et al., 2003; Sakr & Gaber, 2014).  The ASM is designed to store all tuples required by the Aurora network.  The ASM requires two main operations; one to manage storage for the tuples being passed through an Aurora network, and the second operations must maintain extra tuple storage which may be required at the connection point.  Thus, the ASM involves two main management operations: (1) the Queue Management, and (2) the Connection Point Management (Abadi et al., 2003; Sakr & Gaber, 2014).  

The RTS in Aurora is challenging because of the need to simultaneously address several issues such as large system scale, real-time performance requirements, and dependencies between box executions (Abadi et al., 2003; Sakr & Gaber, 2014).  Besides, the processing of tuple in Aurora spans many scheduling and execution steps, where the input tuple goes through many boxes before potentially contributing to an output stream, which may require secondary storage (Abadi et al., 2003; Sakr & Gaber, 2014). The Aurora systems reduce the overall processing costs by using two main non-linearities when processing tuples: “Interbox Non-Linearity,” and the “Intrabox Non-Linearity” techniques.  The Aurora systems take advantages of the Non-Linearity technique in both the Interbox and the Intrabox tuple processing through the “Train Scheduling” (Abadi et al., 2003; Sakr & Gaber, 2014).  The “Train Scheduling” is a set of scheduling heuristics which attempt (1) to have boxes queue as many tuples as possible without processing, thus generating long tuple trains, (2) to process complete trains at once, thus using the “Intrabox Non-Linearity” technique, and (3) to pass them to subsequent boxes without having to go to disk, thus employing the “Interbox Non-linearity” technique (Abadi et al., 2003; Sakr & Gaber, 2014).  The primary goal of the “Train Scheduling” is to minimize the number of I/O operations performed per tuple.  The secondary goal of the “Train Scheduling is to minimize the number of box calls made per tuple. With regard to the Introspection technique, Aurora systems employ static and dynamic or run-time introspection techniques to predict and detect overload situation (Abadi et al., 2003; Sakr & Gaber, 2014).  The purpose of the static introspection technique is to determine if the hardware running the Aurora network is sized correctly.  The dynamic analysis which is based on the run-time introspection technique uses timestamps for all tuples (Abadi et al., 2003; Sakr & Gaber, 2014).   With regard to the “Load Shedding”, Aurora systems reduces the volume of the tuple processing via the load shedding if an overload is detected as a result of the static or dynamic analysis, by either dropping the tuples or filtering the tuples (Abadi et al., 2003; Sakr & Gaber, 2014).   Figure 2 illustrates the Aurora Run-Time Architecture, adapted from (Abadi et al., 2003; Sakr & Gaber, 2014).

Figure 2:  Aurora Run-Time Framework. Adapted from (Abadi et al., 2003).

The Aurora optimization techniques involve two main optimization systems: (1) the dynamic continuous query optimization, and (2) the ad-hoc query optimization. The dynamic continuous query optimization involves the inserting projections, the combining boxes, and the reordering boxes optimization techniques (Abadi et al., 2003). The ad-hoc query optimization involves the historical information because Aurora semantics require the historical sub-network to be run first.  This historical information is organized in a B-tree data model (Abadi et al., 2003).  The initial boxes in an ad-hoc query can pull information from the B-tree associated with the corresponding connection point (Abadi et al., 2003).  When the historical operation is finished, the Aurora optimization technique switches the implementation to the standard push-based data structures and continues processing in the conventional mode (Abadi et al., 2003).

1.4 Aurora* and Medusa for Distributed Stream Processing

The Aurora System is a centralized stream processor.   However, in (Cherniack et al., 2003).   Aurora* and Medusa are proposed for distributed processing.  Several architectural issues must be addressed for building a large-scale distributed version of a stream processing system such as Aurora.  In (Cherniack et al., 2003), the problem is divided into two categories:  intra-participant distribution, and inter-participant distribution.  The intra-participant distribution involves small-scale distribution within one administrative domain which can be handled by the proposed model of Aurora* (Cherniack et al., 2003).  The inter-participant distribution involves large-scale distribution across administrative boundaries, which is handled by the proposed model of Medusa (Cherniack et al., 2003).

2. Borealis Streaming Processing Engine

Borealis is described as the second generation of the Distributed SPE which also got developed at Brandeis University, Brown University and MIT (Abadi et al., 2005; Sakr & Gaber, 2014).  The Borealis streaming model inherits the core functionality of the stream processing from Aurora model, and the core functionality of the distribution from Medusa model (Abadi et al., 2005; Sakr & Gaber, 2014).   The Borealis model is an expansion and extension of both models to provide more advanced capabilities and functionalities which are commonly required by newly-emerging stream processing applications (Abadi et al., 2005; Sakr & Gaber, 2014).   Borealis is regarded to be the successor to Aurora (Abadi et al., 2005; Sakr & Gaber, 2014).

The second generation of the SPE has three main requirements which are critical and at the same time challenging.  The first requirement involves the “Dynamic Revision of Query Results” (Abadi et al., 2005; Sakr & Gaber, 2014).  Applications are forced to live with imperfect results because corrects or updates to previously processed data are only available after the fact unless the system has techniques to revise its processing and results to take into account newly available data or updates (Abadi et al., 2005; Sakr & Gaber, 2014).  The second requirement for the second generation of the SPE involves “Dynamic Query Modification,” which allows runtime with low overhead, fast and automatic modification (Abadi et al., 2005; Sakr & Gaber, 2014).  The third requirement for the second generation of SPE involves “Flexible and Highly-Scalable Optimization,” where the optimization problem will be more balanced between the sensor-heavy and server-heavy optimization.  The more flexible optimization structure is needed to deal with a large number of devices and perform cross-network sensor-heavy server-heavy resource management and optimization (Abadi et al., 2005; Sakr & Gaber, 2014). However, this requirement for such optimization framework has two additional challenges.  The first challenge is the ability to simultaneously optimize different QoS metrics such as processing latency, throughput, or sensor lifetime (Abadi et al., 2005; Sakr & Gaber, 2014).  The second challenge of such flexible optimization structure and framework is the ability to perform optimizations at different levels of granularity at the node level, sensor network level, a cluster of sensors and server level and so forth (Abadi et al., 2005; Sakr & Gaber, 2014).  These advanced challenges, capabilities, and requirements for the second-generation of SPE are added to the classical architecture of the SPE to form and introduce Borealis framework (Abadi et al., 2005; Sakr & Gaber, 2014).

2.1 The Borealis Framework

            The Borealis framework is a distributed stream processing engine where the collection of continuous queries submitted to Borealis can be seen as a giant network of operators whose processing is distributed to multiple sites (Abadi et al., 2005; Sakr & Gaber, 2014). There is a sensor proxy interface which acts as another Borealis site (Abadi et al., 2005; Sakr & Gaber, 2014).  The sensor networks can participate in query processing behind that sensor proxy interface (Abadi et al., 2005; Sakr & Gaber, 2014).

            Borealis server runs on each node with Global Catalog (GC), High Availability (HA) module, Neighborhood Optimizer (NHO), Local Monitor (LM), Admin, Query Processor (QP)at the top and meta-data, control and data at the bottom of the framework. The GC can be centralized or distributed across a subset of processing nodes, holding information about the complete query network and the location of all query fragments (Abadi et al., 2005; Sakr & Gaber, 2014).  The HA modules monitor each node to handle any failure (Abadi et al., 2005; Sakr & Gaber, 2014).  The NHO utilizes the local information and other information from other NHOs to improve the load balance between the nodes (Abadi et al., 2005; Sakr & Gaber, 2014).  The LM collects performance-related statistics, while the local system reports to the local optimizer as well as the NHOs (Abadi et al., 2005; Sakr & Gaber, 2014).  The QP is the core component of the Borealis’ framework.  The actual execution of the query is implemented in the QP (Abadi et al., 2005; Sakr & Gaber, 2014).  The QP, which is a single site processor, receives the input data streams, and the result is pulled through the I/O Queue, routing the tuples to and from remote Borealis node and clients (Abadi et al., 2005; Sakr & Gaber, 2014).  The Admin module controls the QP, and issues system control messages (Abadi et al., 2005; Sakr & Gaber, 2014).  These messages are pushed to the Local Optimizer (LO), which communicates with Run-Time major components of the QP to enhance the performance.  These Run-Time major components of the Borealis include (1) the Priority Scheduler, (2) Box Processors, and (3) Load Shedder.  The Priority Scheduler determines the order of box execution based on the priority of the tuples.   The Box Processors can change the behavior during the run-time based on the messages received from the LO.  The Load Shedder discards the low-priority tuples when the node is overloaded (Abadi et al., 2005; Sakr & Gaber, 2014).  The Storage Manager is part of the QP and responsible for storing and retrieving data which flows through the arcs of the local query diagram.  The Local Catalog is another component of the QP to store the query diagram description and metadata and is accessible by all components.  Figure 3 illustrates Borealis’ framework, adapted from (Abadi et al., 2005; Sakr & Gaber, 2014).

Figure 3.  Borealis’ Framework, adapted from (Abadi et al., 2005; Sakr & Gaber, 2014).

2.2 Borealis’ Query Model and Comparison with Aurora’s Query Model

            Borealis inherits the Aurora Model of boxes-and-arrows to specify the continuous queries, where the boxes reflect the query operators and the arrows reflect the data flow between the boxes (Abadi et al., 2005; Sakr & Gaber, 2014).  Borealis extends the data model of Aurora by supporting three types of messages of the insertion, the deletion, and the replacement (Abadi et al., 2005; Sakr & Gaber, 2014).  The Borealis’ queries are an extended version of Aurora’s operators to support revision messages (Abadi et al., 2005; Sakr & Gaber, 2014).   The query model of Borealis supports the modification of the box semantic during the runtime (Abadi et al., 2005; Sakr & Gaber, 2014).  The QoS in Borealis is like in Aurora forms the basis of resource management decision.  However, while each query output is provided with QoS function in Aurora’ model, Borealis allows QoS to be predicted at any point in the data flow (Abadi et al., 2005; Sakr & Gaber, 2014).  Thus, Borealis supports a Vector of Metrics for supplied messages to allow such prediction of QoS.

In the context of the query result revision, Borealis supports “replayable” query diagram and the processing scheme revision.  While Aurora has an append-only model where a message cannot be modified once it is placed on a stream providing an approximate or imperfect result, the Borealis’ model supports the modification of messages to processes the query intelligently and provide correct query results (Abadi et al., 2005; Sakr & Gaber, 2014).   The query diagram must be replayable when messages are revised and modified because the processing of the modified message must replay a portion of the past with the modified value (Abadi et al., 2005; Sakr & Gaber, 2014).   This replaying process is also useful for recovery and high availability (Abadi et al., 2005; Sakr & Gaber, 2014). This dynamic revision with the replaying process can add more overhead.  Thus, the “closed” model is used to generates deltas to show the effects of the revisions instead of the entire result.

In the context of the queries modification, Borealis provides online modification of continuous queries by supporting the control lines, and the time travel features.  The control lines extend the basic query model of Aurora to change operator parameters and operators themselves during the run-time (Abadi et al., 2005; Sakr & Gaber, 2014).  The Borealis’ boxes contain the standard data input lines and special control lines which carry messages with revised box parameters and new box function (Abadi et al., 2005; Sakr & Gaber, 2014).   Borealis provides a new function called “Bind” to bind the new parameters to free variables within a function definition, which will lead to a new function to be created (Abadi et al., 2005; Sakr & Gaber, 2014).   The Aurora’s connections points are leveraged to enable the time travel in Borealis.  The original purpose of the connection points was to support ad-hoc queries, which can query historical and run-time data.  This concept is extended in Borealis model to include connection point views to enable time travel applications, ad-hoc queries and the query diagram to access the connection points independently and in parallel (Abadi et al., 2005; Sakr & Gaber, 2014).   The connection point views include two operations to enable the time travel:  the replay operation, and the undo operation.  

2.3  The Optimization Model of Borealis

Borealis has an optimizer framework to optimize processing across a combined sensor and server network, to deal with the QoS in stream-based applications, and to support scalability, size-wise and geographical stream-based applications.   The optimization model contains multiple collaborating monitoring and optimization components.  The monitoring components include the local monitor at every site and end-point monitor at output sites.  The optimization components include the global optimizer, neighborhood optimizer, and local optimizer (Abadi et al., 2005).   While Aurora evaluated the QoS only at outputs and had a difficult job inferring QoS at upstream nodes, Borealis can evaluate the predicted-QoS score function on each message by utilizing the values of the Metrics Vector (Abadi et al., 2005).   Borealis utilizes Aurora’ concept of train scheduling of boxes and tuples to reduce the scheduling overhead.  While Aurora processes the message in order of arrival, Borealis contains box scheduling flexibility which allows processing message out of order because the revision technique can be used to process them later as insertions (Abadi et al., 2005).  Borealis offers a superior load shedding technique than Aurora’s technique (Abadi et al., 2005).  The Load Shedder in Borealis detects and handle overload situations by adding the “drop” operators to the processing network (Ahmad et al., 2005).  The “drop” operator aims to filter out messages, either based on the value of the tuple or in a randomized fashion, meaning out of order to overcome the overload (Ahmad et al., 2005).  The higher quality outputs can be achieved by allowing nodes in a chain to coordinate in choosing where and how much load to shed.  Distributed load shedding algorithms are used to collect local statistics from nodes and pre-computes potential drop plans at the compilation time (Ahmad et al., 2005).  Figure 4 illustrates the Optimization Components of Borealis, adapted from (Abadi et al., 2005).

Figure 4.  The Optimization Components of Borealis, adapted from (Abadi et al., 2005).

            Borealis provides a fault-tolerance technique in a distributed SPE such as replication, running multiple copies of the same query network on distinct processing nodes (Abadi et al., 2005; Balazinska, Balakrishnan, Madden, & Stonebraker, 2005).  When a node experiences a failure on one of its input streams, the node tries to find an alternate upstream replica.  All replicas must be consistent.  To ensure such consistency, data-serializing operator “SUnion” is used to take multiple streams as input and produces one output stream with deterministically ordered tuples, to ensure all operators of the replica processing the same input in the same order (Abadi et al., 2005; Balazinska et al., 2005).   To provide high availability, each SPE ensures that input data is processed and results forwarded within a user-specified time threshold of its arrival (Abadi et al., 2005; Balazinska et al., 2005).  When the failure is corrected, each SPE which experienced tentative data reconciles its state and stabilizes its output by replacing the previously tentative output with stable data tuples forwarded to downstream clients, reconciling the state of SPE based on checkpoint/redo, undo/redo and the revision tuples new concept (Abadi et al., 2005; Balazinska et al., 2005).

Conclusion

                This project discussed and analyzed advanced processing of Big Data.  There are various processing systems such as Iterative Processing, Graph Processing, Stream Processing also known as Event Processing or Real-Time Processing, and Batch Processing.    A MapReduce-based framework such as Hadoop supports the Batch-Oriented Processing.  MapReduce also lacks the built-in support for the Iterative Processing which requires parsing datasets iteratively, large Graph Processing, and Stream Processing.  Thus, various models such as Twister, HaLoop, and iMapReduce are introduced to improve the Iterative Processing of the MapReduce. With regard to the Graph Processing, MapReduce is suitable for processing flat data structures, such as vertex-oriented tasks and propagation is optimized for edge-oriented tasks on partitioned graphs.  However, various models are introduced to improve the programming models for large graph processing such as Surfer, Apache Hama, GoldenOrb, Giraph, Pregel, GraphLab.  With regard to the Stream Processing, various models are also introduced to overcome the limitation of the MapReduce framework which deals only with batch-oriented processing.  These Stream Processing models include Aurora, Borealis, IBM Space, StreamCloud, Stormy, Twitter Storm, Spark Streaming, Apache Storm, StreamMapReduce, Simple Scalable Streaming System (S4), and IBM InfoSphere Streams.  This project focused the discussion and the analysis of the Stream Processing models of Aurora and Borealis.  The discussion and the analysis of Aurora model included an overview of the Aurora model as Streaming Processing Engine (SPE), followed by the Aurora Framework and the fundamental components of the Aurora topology.  The Query Model of Auroral, which is known as Streak Query Algebra “SQuAI,” supports seven operators constructing the Aurora network and queries for expressing its stream processing requirements.   The discussion and analysis also included the “SQuAl” and the Query Model, the Run-Time Framework and the Optimization systems.  The Aurora* and Medusa as Distributed Stream Processing are also discussed and analyzed.  The second SPE is Borealis which is a Distributed SPE.  The discussion and the analysis of the Borealis involved the framework, the query model, and the optimization technique.  Borealis is an expansion to Aurora’s SPE to include and support features which are required for the Distributed Real-Time Streaming.  The comparison between Aurora and Borealis is also discussed and analyzed at all levels from the network, query model, and the optimization techniques. 

References

Abadi, D. J., Ahmad, Y., Balazinska, M., Cetintemel, U., Cherniack, M., Hwang, J.-H., . . . Ryvkina, E. (2005). The Design of the Borealis Stream Processing Engine.

Abadi, D. J., Carney, D., Çetintemel, U., Cherniack, M., Convey, C., Lee, S., . . . Zdonik, S. (2003). Aurora: a new model and architecture for data stream management. The VLDB Journal, 12(2), 120-139.

Ahmad, Y., Berg, B., Cetintemel, U., Humphrey, M., Hwang, J.-H., Jhingran, A., . . . Tatbul, N. (2005). Distributed operation in the Borealis stream processing engine. Paper presented at the Proceedings of the 2005 ACM SIGMOD international conference on Management of data.

Balazinska, M., Balakrishnan, H., Madden, S., & Stonebraker, M. (2005). Fault-tolerance in the Borealis distributed stream processing system. Paper presented at the Proceedings of the 2005 ACM SIGMOD international conference on Management of data.

Carney, D., Çetintemel, U., Cherniack, M., Convey, C., Lee, S., Seidman, G., . . . Stonebraker, M. (2002). Monitoring streams—a new class of data management applications. Paper presented at the VLDB’02: Proceedings of the 28th International Conference on Very Large Databases.

Chandarana, P., & Vijayalakshmi, M. (2014, 4-5 April 2014). Big Data analytics frameworks. Paper presented at the Circuits, Systems, Communication and Information Technology Applications (CSCITA), 2014 International Conference on.

Chen, R., Weng, X., He, B., & Yang, M. (2010). Large graph processing in the cloud. Paper presented at the Proceedings of the 2010 ACM SIGMOD International Conference on Management of data.

Chen, R., Yang, M., Weng, X., Choi, B., He, B., & Li, X. (2012). Improving large graph processing on partitioned graphs in the cloud. Paper presented at the Proceedings of the Third ACM Symposium on Cloud Computing.

Cherniack, M., Balakrishnan, H., Balazinska, M., Carney, D., Cetintemel, U., Xing, Y., & Zdonik, S. B. (2003). Scalable Distributed Stream Processing.

Cui, B., Mei, H., & Ooi, B. C. (2014). Big data: the driver for innovation in databases. National Science Review, 1(1), 27-30.

Erl, T., Khattak, W., & Buhler, P. (2016). Big Data Fundamentals: Concepts, Drivers & Techniques: Prentice Hall Press.

Fernández, A., del Río, S., López, V., Bawakid, A., del Jesus, M. J., Benítez, J. M., & Herrera, F. (2014). Big Data with Cloud Computing: an insight on the computing environment, MapReduce, and programming frameworks. Wiley Interdisciplinary Reviews: Data Mining and Knowledge Discovery, 4(5), 380-409.

Gonzalez, J. E., Xin, R. S., Dave, A., Crankshaw, D., Franklin, M. J., & Stoica, I. (2014). GraphX: Graph Processing in a Distributed Dataflow Framework.

Gradvohl, A. L. S., Senger, H., Arantes, L., & Sens, P. (2014). Comparing distributed online stream processing systems considering fault tolerance issues. Journal of Emerging Technologies in Web Intelligence, 6(2), 174-179.

Grolinger, K., Hayes, M., Higashino, W. A., L’Heureux, A., Allison, D. S., & Capretz, M. A. (2014). Challenges for mapreduce in big data. Paper presented at the Services (SERVICES), 2014 IEEE World Congress on.

Gupta, R., Gupta, H., & Mohania, M. (2012). Cloud computing and big data analytics: what is new from databases perspective? Paper presented at the International Conference on Big Data Analytics.

Hu, H., Wen, Y., Chua, T.-S., & Li, X. (2014). Toward scalable systems for big data analytics: A technology tutorial. IEEE Access, 2, 652-687.

Manyika, J., Chui, M., Brown, B., Bughin, J., Dobbs, R., Roxburgh, C., & Byers, A. H. (2011). Big data: The next frontier for innovation, competition, and productivity.

Neumeyer, L., Robbins, B., Nair, A., & Kesari, A. (2010-639). S4: Distributed stream computing platform. Paper presented at the 2010 IEEE International Conference on Data Mining Workshops.

Sakr, S., & Gaber, M. (2014). Large Scale and big data: Processing and Management: CRC Press.

Schwarzkopf, M., Murray, D. G., & Hand, S. (2012). The seven deadly sins of cloud computing research. Paper presented at the Presented as part of the.

Scott, J. A. (2015). Getting Started with Spark: MapR Technologies, Inc.

Spiess, J., T’Joens, Y., Dragnea, R., Spencer, P., & Philippart, L. (2014). Using Big Data to Improve Customer Experience and Business Performance. Bell Labs Tech. J., 18: 13–17. doi:10.1002/bltj.21642

Zhang, Y., Chen, S., Wang, Q., & Yu, G. (2015). i^2MapReduce: Incremental MapReduce for Mining Evolving Big Data. IEEE transactions on knowledge and data engineering, 27(7), 1906-1919.

Zhang, Y., Gao, Q., Gao, L., & Wang, C. (2012). imapreduce: A distributed computing framework for iterative computation. Journal of Grid Computing, 10(1), 47-68.

Extract Knowledge from a Large-Scale Dataset

Dr. Aly, O.
Computer Science

Introduction

The purpose of this discussion is to discuss and analyze one research work which involves knowledge extraction from a large-scale dataset with specific real-world semantics by applying machine learning.  The discussion begins with an overview of Linked Open Data, Semantic Web Application, and Machine Learning.   The discussion also addresses Knowledge Extraction from Linked Data, its eight-phase lifecycle, and examples of Linked Data-driven applications.  The discussion focuses on DBpedia as an example of such applications. 

Linked Open Data, Semantic Web Application, and Machine Learning

The term Linked Data, as indicated in (Ngomo, Auer, Lehmann, & Zaveri, 2014), refers to a set of best practices for publishing and interlinking structured data on the Web.  The Linked Open Data (LOD) is regarded to be the next generation systems recommended on the web (Sakr & Gaber, 2014).  The LOD describes the principles which are designated by Tim Berners-Lee to publish and connect the data on the web (Bizer, Heath, & Berners-Lee, 2011; Sakr & Gaber, 2014).  These Linked Data principles include the use of URIs as names for things, HTTP URIs, RDF, SPARQL, and the Link of RDF to other URIs (Bizer et al., 2011; Ngomo et al., 2014; Sakr & Gaber, 2014). The LOD cloud, as indicated in (Sakr & Gaber, 2014), covers more than an estimated fifty billion facts from various domains like geography, media, biology, chemistry, economy, energy and so forth.  Semantic web offers cost-effective techniques to publish data in a distributed environment (Sakr & Gaber, 2014).  The Semantic Web technologies are used to publish structured data on the web, set links between data from one data source to data within other data sources (Bizer et al., 2011).  The LOD implements the Semantic Web concepts where organizations can upload their data on the web for open use of their information (Sakr & Gaber, 2014).   The underlying technologies behind the LOD involves the Uniform Resource Identifiers (URI), HyperText Transfer Protocol (HTTP), Resource Description Framework (RDF).  The properties of the LOD include any data, anyone can publish on the Web of Data, Data publishers are not constrained in choice of vocabularies to present data, and entities are connected by RDF links (Bizer et al., 2011).  The LOD applications include Linked Data Browsers, The Search Engines, and Domain-Specific Applications (Bizer et al., 2011).  Examples of the Linked Data Browsers are Tabulator Browser (MIT, USA), Marbles (FU Berlin, DE), OpenLink RDF Browser (OpenLink, UK), Zitgist RDF Browser (Zitgist, USA), Humboldt (HP Labs, UK), Disco Hyperdata Browser (FU Berlin, DE), and Fenfire (DERI, Irland) (Bizer et al., 2011).   Examples of the Search Engines include two types, (1) Human-Oriented Search Engines, and (2) Application-Oriented Indexes.  The Human-Oriented Search Engines examples are Falcons (IWS, China), and “Sig.ma” (DERI, Ireland).  The Application-Oriented Indexes examples include Swoogle (UMBC, USA), VisiNav (DERI, Irland), and Watson (Open University, UK).   The Domain-Specific Applications examples include a “mashing up” data from various Linked Data sources such as Revyu, DBpedia Mobile, Talis Aspire, BBC Programs and Music, and DERI Pipes (Bizer et al., 2011).  There are various challenges for the LOP applications such as user Interfaces and Interaction Paradigms; Application Architectures; Schema Mapping and Data Fusion; Link Maintenance; Licensing; Trust, Quality, and Relevance; and Privacy (Bizer et al., 2011).

Machine Learning is described by (Holzinger, 2017) as the fastest growing technical field.  The primary goal of the Machine Learning (ML) is to develop software which can learn from the previous experience, where a usable intelligence can be reached.  ML is categorized into “supervised,” and “unsupervised” learning techniques depending on whether the output values are required to be present in the training data (Baştanlar & Özuysal, 2014).  The “unsupervised” learning technique requires only the input feature values in the training data, and the learning algorithm discovers hidden structure in the training data based on them (Baştanlar & Özuysal, 2014).  The “Clustering” techniques which partition the data into coherent groups fall into this category of “unsupervised” learning (Baştanlar & Özuysal, 2014).  The “unsupervised” techniques are used in the biometrics for problems such as microarray and gene expression analysis (Baştanlar & Özuysal, 2014).  Market segment analysis, grouping people according to their social behavior, and categorization of articles according to their topics are the common tasks which involve clustering and “unsupervised” learning (Baştanlar & Özuysal, 2014).  Typical clustering algorithms are K-means, Hierarchical Clustering, and Spectral Clustering (Baştanlar & Özuysal, 2014).  The “supervised” learning techniques require the value of the output variable for each training sample to be known (Baştanlar & Özuysal, 2014). 

To improve the structure, semantic richness and quality of Linked Data, the existing algorithm of the ML need to be extended from basic Description Logics such as ALC to expressive ones such as SROIQ(D) to serve as the basis of OWL 2 (Auer, 2010).  The algorithms need to be optimized for processing very large-scale knowledge bases (Auer, 2010).  Moreover, tools and algorithms must be developed for user-friendly knowledge representation, maintenance, and repair which enable detecting and fixing any inconsistency and modeling errors (Auer, 2010).

Knowledge Extraction from Linked Data

There is a difference between Data Mining (DM) and Knowledge Discovery (KD) (Holzinger & Jurisica, 2014).  Data Mining is described in (Holzinger & Jurisica, 2014) as “methods, algorithms, and tools to extract patterns from data by combining methods from computational statistics and machine learning: Data mining is about solving problems by analyzing data present in databases” (Holzinger & Jurisica, 2014).  Knowledge Discovery, on the other hands, is described in (Holzinger & Jurisica, 2014) as “Exploratory analysis and modeling of data and the organized process of identifying valid, novel, useful and understandable patterns from these data sets.”  However, some researchers argue there is no difference between DM and KD.  In (Holzinger & Jurisica, 2014), Knowledge Discovery and Data Mining (KDD) are of equal importance and necessary in combination.

Linked Data has a lifecycle with eight phases: (1) Extraction, (2) Storage and Querying, (3) Authoring, (4) Linking, (5) Enrichment, (6) Quality Analysis, (7) Evolution and Repair, and (8) Search, Browsing, and Exploration (Auer, 2010; Ngomo et al., 2014).  The information which is represented in unstructured forms or semi-structured forms must be mapped to the RDF data model which reflects the Extraction first phase (Auer, 2010; Ngomo et al., 2014).  When there is a critical mass of RDF data, techniques must be implemented to store, index and query this RDF data efficiently which reflects the Storage and Querying the second phase.  New structured information or correction and extension to the existing information can be implemented at the third phase called “Authoring” phase (Auer, 2010; Ngomo et al., 2014).  If information about the same or related entities is published by different publishers, links between those different information assets have to be established in the Linking phase.   During the Linking phase, there is a lack of classification, structure and schema information, which can be tackled in the Enrichment phase by enriching data with the higher-level structure to aggregate and query the data more efficiently.  The Data Web, similar to the Document Web can contain a variety of information of different quality, and hence strategies for quality evaluation and assessment of the data published must be established which is implemented at the Quality Analysis phase.  When a quality problem is detected, strategies to repair the problem and to support the evolution of Linked Data must be implemented at the Evolution and Repair phase.  The last phase of the Linked Data is for users to browse, search and explore the structured information available on the Data Web fast and in a user-friendly fashion (Auer, 2010; Ngomo et al., 2014).

The Linked Data-driven applications are categorized into four categories: (1) Content reuse applications such as BBC’s Musing store which reuses metadata from DBPedia and MusicBrainz, (2) Semantic Tagging and Rating applications such as Faviki which employs unambiguous identifiers from DBPedia, (3) Integrated Question-Answering Systems such as DBPedia Mobile with the ability to indicate locations from the DBPedia dataset in the user’s vicinity, and (4) Event Data Management Systems such as Virtuoso’s ODS-Calendar with the ability to organize events, tasks, and notes (Konstantinou, Spanos, Stavrou, & Mitrou, 2010).  

Integrative, and interactive Machine Learning is the future for Knowledge Discovery and Data Mining.  This concept is demonstrated by (Sakr & Gaber, 2014) using the environmental domain, and in (Holzinger & Jurisica, 2014) using the biomedical domain.  Other applications of LOD include DBpedia which reflects the Linked Data version of Wikipedia, BBC’s Platform for the World Cup 2010 and the 2012 Olympic game (Kaoudi & Manolescu, 2015).   RDF dataset can involve a large volume of data such as data.gov which contains more than five billion triples, while the latest version of DBpedia corresponding to more than 2 billion triples (Kaoudi & Manolescu, 2015).  The Linked Cancer Genome Atlas dataset consists of 7.36 billion triples and is estimated to reach 20 billion as cited in (Kaoudi & Manolescu, 2015).  Such triple atoms have been reported to be frequent in real-world SPARQL queries, reaching about 78% of the DBpedia query log and 99.5% of the Semantic Web Dog query log as cited in (Kaoudi & Manolescu, 2015).  The focus of this discussion is on DBPedia to extract out the knowledge from a large-scale dataset with real-world semantics by applying machine learning. 

DBpedia

DBpedia is a community project which extracts structured, multi-lingual knowledge from Wikipedia and makes it available on the Web using Semantic Web and Linked Data technologies (Lehmann et al., 2015; Morsey, Lehmann, Auer, Stadler, & Hellmann, 2012). DBpedia is interlinked with several external data sets following the Linked Data principles (Lehmann et al., 2015). It develops a large-scale, multi-lingual knowledge based by extracting structured data from Wikipedia editions (Lehmann et al., 2015; Morsey et al., 2012) in 111 languages (Lehmann et al., 2015).  Using DBpedia knowledge base, several tools have been developed such as DBpedia Mobile, Query Builder, Relation Finder, and Navigator (Morsey et al., 2012).  DBpedia is used for several commercial applications such as Muddy Boots, Open Calais, Faviki, Zemanta, LODr, and TopBraid Composer (Bizer et al., 2009; Morsey et al., 2012). 

The technical framework of DBpedia extraction involves four phases of Input, Parsing, Extraction, and Output (Lehmann et al., 2015).   The input phase involves Wikipedia pages which are read from an external source using either a dump from Wikipedia or MediaWiki API (Lehmann et al., 2015).  The Parsing phase involves parsing Wikipedia pages using wiki parser which transforms the source code of a Wikipedia page into an Abstract Syntax Tree (Lehmann et al., 2015).  In the Extraction phase, the Abstract Syntax Tree of each Wikipedia page is forwarded to the extractor to extract many things such as labels, abstracts, or geographical coordinates (Lehmann et al., 2015).   A set of RDF statements is yielded by each extractor which consumes an Abstract Syntax Tree (Lehmann et al., 2015).  The Output phase involves writing the collected RDF statements to a sink supporting different formats such as N-Tiples (Lehmann et al., 2015).   The DBpedia extraction framework uses various extractors for translating different parts of Wikipedia pages to RDF statements (Lehmann et al., 2015).  The extraction framework of DBpedia is divided into four categories:  Mapping-Based Infobox Extraction, Raw Infobox Extraction, Feature Extraction, and Statistical Extraction (Lehmann et al., 2015).  The DBpedia extraction framework involves two workflows: Dump-based Extraction, and the Live Extraction.  The Dump-based Extraction workflow employs the Database Wikipedia page collection as the source of article texts, and the N-Triples serializer as the output destination (Bizer et al., 2009).  The knowledge base result is made available as Linked Data for download and via DBpedia’s main SPARQL endpoint (Bizer et al., 2009).  The Live Extraction workflow employs the update stream to extract new RDF whenever an article is changed in Wikipedia (Bizer et al., 2009).  The Live Wikipedia page collection access the article text to obtain the current version of the article encoded according to the OAI-PMH protocol (The Open Archives Initiative Protocol for Metadata Harvesting) (Bizer et al., 2009).  The SPARQL-Update Destination removes the existing information and inserts new triples into a separate triple store (Bizer et al., 2009).   The time for DBpedia to reflect the latest update of Wikipedia is between one to two minutes by (Bizer et al., 2009).  The update stream causes performance issue and the bottleneck as the changes need more than one minutes to arrive from Wikipedia (Bizer et al., 2009).

References

Auer, S. (2010). Towards creating knowledge out of interlinked data.

Baştanlar, Y., & Özuysal, M. (2014). Introduction to machine learning miRNomics: MicroRNA Biology and Computational Analysis (pp. 105-128): Springer.

Bizer, C., Heath, T., & Berners-Lee, T. (2011). The linked data-the story so far.

Bizer, C., Lehmann, J., Kobilarov, G., Auer, S., Becker, C., Cyganiak, R., & Hellmann, S. (2009). DBpedia-A crystallization point for the Web of Data. Web Semantics: Science, Services, and Agents on the World Wide Web, 7(3), 154-165.

Holzinger, A. (2017). Introduction To MAchine Learning & Knowledge Extraction (MAKE). Machine Learning & Knowledge Extraction.

Holzinger, A., & Jurisica, I. (2014). Knowledge discovery and data mining in biomedical informatics: The future is in integrative, interactive machine learning solutions Interactive knowledge discovery and data mining in biomedical informatics (pp. 1-18): Springer.

Kaoudi, Z., & Manolescu, I. (2015). RDF in the clouds: a survey. The VLDB Journal, 24(1), 67-91.

Konstantinou, N., Spanos, D.-E., Stavrou, P., & Mitrou, N. (2010). Technically approaching the semantic web bottleneck. International Journal of Web Engineering and Technology, 6(1), 83-111.

Lehmann, J., Isele, R., Jakob, M., Jentzsch, A., Kontokostas, D., Mendes, P. N., . . . Auer, S. (2015). DBpedia–a large-scale, multilingual knowledge base extracted from Wikipedia. Semantic Web, 6(2), 167-195.

Morsey, M., Lehmann, J., Auer, S., Stadler, C., & Hellmann, S. (2012). Dbpedia and the live extraction of structured data from Wikipedia. The program, 46(2), 157-181.

Ngomo, A.-C. N., Auer, S., Lehmann, J., & Zaveri, A. (2014). Introduction to linked data and its lifecycle on the web. Paper presented at the Reasoning Web International Summer School.

Sakr, S., & Gaber, M. (2014). Large Scale and big data: Processing and Management: CRC Press.

Graph Dataset Partitioning Methods

Dr. Aly, O.
Computer Science

Introduction

Cloud Computing programs are designed to serve certain purposes.  They can be tailored for Graph or Data Parallelism, which require the utilization of the data striping and distribution or graph partitioning and mapping (Sakr & Gaber, 2014).  The Data Parallelism (DPLL) is distinguished from the Graph Parallelism (GPLL). The DPLL is described as a form of parallelizing computation as a result of distributing data across multiple nodes and running corresponding tasks in parallel on those machines.  The DPLL is achieved when each machine runs one or many tasks over different partitions of data (Sakr & Gaber, 2014).  MapReduce uses the DPLL where Hadoop Distributed File System (HDFS) partition the input datasets into blocks allowing MapReduce to effectively utilize the DPLL through running a map task per one or many blocks. The GPLL, on the other hand, is described as another form of parallelism which focuses more on distributing graphs as opposed to data (Sakr & Gaber, 2014).  The GPLL is widely used in many domains such as Machine Learning (ML), Data Mining (DM), Physics, and many others.

The graph can be distributed over machines or nodes in a distributed system using various types of Graph Partitioning (GPRT) (Hendrickson & Kolda, 2000; Sakr & Gaber, 2014).  When using the GPRT techniques, the work and the vertices are divided over distributed nodes for efficient distributed computation (Hendrickson & Kolda, 2000; Sakr & Gaber, 2014).  As the case with DPLL, the underlying concept of the GPRT is to process different parts of the graph in parallel by distributing a large graph across many nodes in the cluster (Sakr & Gaber, 2014).  Thus, GPRT allows and enables GPLL (Sakr & Gaber, 2014).  The main objectives of the GPRT are to distribute the work uniformly over many processors by partitioning the vertices into these processors equally weighted partitions while minimizing inter-processor communication reflected by edges crossing between partitions (Hendrickson & Kolda, 2000; Sakr & Gaber, 2014).  This technique is called “Edge Cut Metric” (Hendrickson & Kolda, 2000; Sakr & Gaber, 2014). Pregel and GraphLab are good examples of using the GPRT technique.   

There are Standard GPRT techniques which have various flaws and limitations as discussed below.  There are alternative models such as Bipartite Graph Model, Hypergraph Model, Multi-Constraint Partitioning Model, and Skewed Partitioning Model.  These models are only viable if efficient and effective algorithms can be developed to partition them (Hendrickson & Kolda, 2000).   Various research studies have demonstrated that the Multi-Level paradigm for partitioning is proved to be robust and general. Several researchers developed this paradigm independently in the early 1990s and became popular and known as Chaco and METIS partitioning tools.  Regarding the graph processing, there are various Cloud-Based Graph Processing Platforms such as Pregel, PEGASUS, HADI, Surfer, Trinity, and GraphLab (Sakr & Gaber, 2014). 

This discussion and analysis of the alternative Graph Partitioning Models are limited only to Bipartite Graph Model and Multi-Constraint Partitioning Model.  The discussion begins with the Standard Graph Partitioning Techniques with an analysis of their flaws and limitations.  Moreover, the discussion and analysis of the Cloud-Based Graph Processing Platforms are limited to Pregel and GraphLab.

The Standard Graph Partitioning Approach

The graph is a set of vertices and edges, where vertices of the graph can represent units of computations, and the edges can encode data dependencies (Hendrickson & Kolda, 2000).  The Standard Graph Partitioning approach partition the vertices of the graph into equally weighted sets in such a way that the weight of the edges is minimized when they are crossing between sets (Hendrickson & Kolda, 2000).  Chaco and METIS are well-known software packages which are using this standard approach.  There are shortcomings and limitations to the standard Graph Partitioning approach.  The “Edge Cut Metric” has four major flaws (Hendrickson & Kolda, 2000).  The first flaw of the “Edge Cut Metric” involves the edge cuts which are not proportional to the total communication volume.  Thus, it overcounts the true volume of communication because two or more edges which may be representing the same information flow are not recognized by the edge cut metric.  The second flaw of the “Edge Cut Metric” involves the time to send a message on a parallel computer which is a function of the latency and the size of the message (Hendrickson & Kolda, 2000).  The Graph Partitioning approaches try to minimize the total volume, but not the total number of messages.  In certain scenarios, the message volume can be less important than the message latencies (Hendrickson & Kolda, 2000).  The third flaw of the “Edge Cut Metric” and measure involves the performance of a parallel application which is limited by the slowest processor.  The communication effort can be out of balance although the computational work is in balance.  Thus, the focus should be on minimizing the maximum volume and number of messages handled by any single processor instead of focusing on minimizing the total communication volume or even the total number of messages (Hendrickson & Kolda, 2000).   The last flaw of the “Edge Cut Metric” involves the number of switches the message is routed through to travel distances.  Communication should be restricted to processors which are close to each other to prevent the contention of messages and enhance the overall throughput of the message traffic (Hendrickson & Kolda, 2000). 

The Standard Graph Partitioning technique suffer from four limitations because of the lack of “expressibility” in the model (Hendrickson & Kolda, 2000).  The emphasis in the discussion of (Hendrickson & Kolda, 2000) was on two standard models called “Directed,” and “Undirected” Graph Models.  The first limitation involves the symmetric and un-symmetric data dependencies.  The “Undirected Graph” model can only express symmetric data dependencies (Hendrickson & Kolda, 2000).  If the model is un-symmetric, the dependencies are un-symmetric, which can be represented using a “Directed Graph” model. In the “Directed Graph” model, the edges are directed from the data producing vertex to the data consuming vertex (Hendrickson & Kolda, 2000).  The “Standard” Model cannot represent un-symmetric data dependencies.  There are two solutions to make the “Standard” Model represent un-symmetric dependencies (Hendrickson & Kolda, 2000).  The first solution is to convert the directed edges to undirected edges (un-symmetric to symmetric).  The second solution is an extension to the first solution based on the communication if one-way or two-way.  If the edge represents only one-way communication, it gets a weight of one, and if it represents two-way communication, it gets a weight of two (Hendrickson & Kolda, 2000).  The second limitation is represented in the symmetric model, which forces the partition of the input and output data to be identical (Hendrickson & Kolda, 2000).    Although this approach might be desirable in certain cases, it poses unnecessary restriction in many cases (Hendrickson & Kolda, 2000).   The third limitation of the Standard Model involves the assumption that the input and output of the calculation are the sizes.  The last limitation of the Standard Model involves the several distinct phases for the calculation, which include the application of a matrix and a preconditioner in an iterative method, solving a differential equation and applying boundary conditions, simulating different phenomena in a multi-physics calculation and advancing a grid and detecting contacts in a transient dynamics computation (Hendrickson & Kolda, 2000).  Such a combination of phases cannot be described using the “Undirected Graph” Model.

Graph Partitioning Models Alternatives – Bipartite Model, and Multi-Constraint Partitioning Model

To overcome some of the above flaws and challenges of the Standard Graph Models, some models are proposed and discussed in (Hendrickson & Kolda, 2000).  “Bipartite Graph Model” is proposed to solve the un-symmetric data dependencies and un-symmetric partitions which cannot be encoded by the Undirected Graph Model, because this standard model can encode only symmetric data dependencies and symmetric partitions as discussed in the above flaws section. 

The “Bipartite” Model can be applied to other applications involving un-symmetric dependencies and multiple phases (Hendrickson & Kolda, 2000).  There are three advantages for the “Bipartite” Model.  The first advantage involves the capability of encoding a class which is un-symmetric that cannot be encoded by the standard “Undirected” Graph Model.  The second advantage is that the “Bipartite” model allows for the initial partition to be different from the final partition by representing each vertex twice, once as an initial vertex and once as a final vertex allowing for a reduction in communication (Hendrickson & Kolda, 2000).  However, this model cannot provide a symmetric partition which can be preferred in many applications (Hendrickson & Kolda, 2000).  The third advantage involves the load balance which is offered by partitioning both the initial and the final vertices (Hendrickson & Kolda, 2000).  Although the “Bipartite” Graph Model cover the “expressibility” which is missing from the Standard Graph Models, it is still facing the Edge Cut Metric challenge, sharing the other associated problems which the Standard Models are suffering from (Hendrickson & Kolda, 2000).   The Edge Cut Metric issue can be resolved by enhancing the quantity of the graph using other methods and techniques than the cut edges (Hendrickson & Kolda, 2000). Moreover, the “Bipartite” model cannot encode more than the two main computational operations (Hendrickson & Kolda, 2000).

A solution to the limited two-operation encoding limitation involves a k-partite graph where the first set of vertices is connected to a second set, which is connected to a third set and so on.  This technique is called Multi-Constraint methodology.   This Multi-Constraint technique is not an alternative to the other models, but rather an enhancement to the other models (Hendrickson & Kolda, 2000).  The goal of this model is to partition the vertices of that graph in a way to minimize the communication, while balancing the k weight that is assigned to each vertex, resulting in balancing each computation phase (Hendrickson & Kolda, 2000).  Moreover, this model was developed to minimize the edge cuts (Hendrickson & Kolda, 2000).  Using this model, the edges represent the data dependencies in every phase of all computations (Hendrickson & Kolda, 2000).  This Multi-Constraint Model includes the “Bipartite” and k-partite techniques as a special case.  Although this model is powerful, it is difficult to implement (Hendrickson & Kolda, 2000).

Cloud-Based Graph Processing Platforms of Pregel and GraphLab

Pregel is known as a vertex-oriented graph processing engine which implements a Bulk Synchronous Parallel (BSP) model, where programs are expressed as a sequence of iterations (Sakr & Gaber, 2014). In each of these programs, a vertex can receive messages which are sent in the previous iteration, send messages to other vertices and modify its state.  Google introduced the Pregel system as a scalable platform for the implementation of graph algorithms (Sakr & Gaber, 2014).  Pregel implements the algorithm of the vertex-oriented PageRank under the Message Passing paradigm (Sakr & Gaber, 2014).  Pregel passes the results of the computation between workers, executing Compute() on all vertices in parallel (Sakr & Gaber, 2014).  In Pregel, messages are passed over the network, and vertices can vote to halt if there is no work to do (Sakr & Gaber, 2014).  In Pregel, each vertex in a graph is assigned a unique ID, and partitioning of the graph is accomplished using a hash(ID) mode N function where N is the number of partitions.  The hash function can be modified by users.  After the graph is partitioned, partitions are mapped to cluster machines using a mapping function of a user choice (Sakr & Gaber, 2014).  In Pregel, if graphs or cluster sizes are modified after partitioning, the entire graphs need to be re-partitioned before any processing (Sakr & Gaber, 2014). 

GraphLab, in contrast to Pregel, employs a two-phase partitioning strategy (Sakr & Gaber, 2014).  The input graph is partitioned in the first phase into some partitions using a hash-based random algorithm, while the number of partitions must be larger than the number of the cluster nodes (Sakr & Gaber, 2014). The partition in GraphLab is called an “atom,” where commands are stored to generate vertices and edges (Sakr & Gaber, 2014).  GraphLab maintains in each atom some information about the atom’s neighboring vertices and edges which is denoted as ghosts which are used as a caching capability for efficient adjacent data accessibility (Sakr & Gaber, 2014).  In the second phase of the GraphLab’s two-phase partitioning strategy, GraphLab stores the connectivity structure and the locations of atoms in an atom index file which is referred to as meta-graph.  This meta-graph contains the number of the vertices, and edges encoding connectivity among atoms, and is split uniformly across the cluster nodes (Sakr & Gaber, 2014).  Atoms are then loaded by cluster machines, and each machine constructs its partitions by executing the commands in each of its assigned atoms (Sakr & Gaber, 2014).  GraphLabs allows future modification to the graph to be appended as additional commands in atoms without any requirement to repartition the entire graph by generating partitions through executing commands stored in the atoms (Sakr & Gaber, 2014).  Moreover, the same graph atoms can be reused for different sizes of clusters by simply re-dividing the corresponding atom index file and re-executing atom commands (Sakr & Gaber, 2014).     

Moreover, GraphLab is designed and developed for ML, and DM algorithms, which are not supported naturally by MapReduce (Sakr & Gaber, 2014).  The abstraction of the GraphLab allows asynchronous, dynamic, graph-parallel computation while ensuring the consistency of the data, and achieving a high degree of parallel performance in the Shared-Memory setting (Sakr & Gaber, 2014).  This asynchronous parallel model of GraphLab is different from Pregel BSP model (Sakr & Gaber, 2014).  The GraphLab framework is extended to the distributed setting while ensuring strong data consistency (Sakr & Gaber, 2014).

How To Handle the Unevenness of the Cloud Network Bandwidth

The large graph can have over hundreds of gigabytes which require data-intensive processing (Chen et al., 2012; Hendrickson & Kolda, 2000; Sakr & Gaber, 2014).  The Cloud Computing environment is described to be a good fit for processing large graph, the (Chen et al., 2012; Hendrickson & Kolda, 2000; Sakr & Gaber, 2014).  The graph processing systems support a vertex-oriented execution model which allows users to develop custom logics on vertices (Chen et al., 2012).  However, the random access on the vertex-oriented computation can generate a significant amount of network traffic (Chen et al., 2012).  The GPRT technique is known to be effective to reduce the network traffic in graph processing (Chen et al., 2012; Hendrickson & Kolda, 2000; Sakr & Gaber, 2014).  However, in the Cloud environment, the GPRT needs to be effectively integrated into large graph processing (Chen et al., 2012; Sakr & Gaber, 2014).  The network bandwidth of the Cloud environment is uneven among various machine pairs, where the machines are grouped first into “pods,” which are connected high-level switches (Chen et al., 2012; Sakr & Gaber, 2014).  The bandwidth of the intra-pod is higher than the bandwidth of the cross-pod (Chen et al., 2012; Sakr & Gaber, 2014).  Moreover, the users are not aware of the topology information due to the virtualization techniques which is employed by the Cloud (Chen et al., 2012; Sakr & Gaber, 2014).   Thus, the unevenness of the Cloud network bandwidth requires network optimizations and tuning on graph partitioning and processing (Chen et al., 2012; Sakr & Gaber, 2014).   A framework is proposed by (Chen et al., 2012; Sakr & Gaber, 2014), which is described as the network performance aware graph partitioning with the aim to improve the network performance of the graph partitioning process (Chen et al., 2012; Sakr & Gaber, 2014).  The underlying concept of the framework is to partition, store, and process the graph partitions based on their number of cross-partition edges (Chen et al., 2012; Sakr & Gaber, 2014).  Thus, the partition with a large number of cross-partition edges is stored in the machines with the high network bandwidth between them because the network traffic for those graph partitions requires high bandwidth (Chen et al., 2012; Sakr & Gaber, 2014).  This framework partitions both the data graph and machine graph and is known as “Machine Graph” framework (Chen et al., 2012; Sakr & Gaber, 2014).  This framework is described as complete weighted undirected graph models the machines which are chosen for graph partitioning to capture the unevenness of the network bandwidth (Chen et al., 2012; Sakr & Gaber, 2014).  Each chosen machine is modeled as a vertex; an edge represents the connectivity between the two machines (Chen et al., 2012; Sakr & Gaber, 2014).  The bandwidth between any two machines is represented as the weight of an edge (Chen et al., 2012; Sakr & Gaber, 2014).   The machine graph can be built with no knowledge or control of the physical network topology (Chen et al., 2012; Sakr & Gaber, 2014). 

Partition Sketch is another framework proposed by (Chen, Weng, & He; Sakr & Gaber, 2014) for the unevenness of the network bandwidth in the Cloud environment.  Using the Partition Sketch, the process of a multi-level graph partitioning algorithm is modeled as a “tree structure” (Sakr & Gaber, 2014).  In this framework, each node represents the graph acting as the input for the partition operation at a level of the entire graph partitioning process (Chen et al.; Sakr & Gaber, 2014).  It begins with the root node which represents the input graph, followed by the non-leaf nodes at the level of ( i + 1) which represents the partitions of the ith iteration, and the leaf nodes represent the graph partitions which are generated by the multi-level graph partitioning algorithm.  This framework of the Partition Sketch is described as a binary tree since the graph partitioning is often implemented using “bisection” (Chen et al.; Sakr & Gaber, 2014).  The “Graph Machine,” and “Partition Sketch” framework are proposed frameworks for the network bandwidth aware graph partitioning techniques for the cloud (Chen et al.; Sakr & Gaber, 2014).   These frameworks enhance a popular multilevel graph partitioning algorithm with the network performance awareness (Chen et al.; Sakr & Gaber, 2014). 

References

Chen, R., Weng, X., & He, B. On the efficiency and programmability of large graph processing in the cloud.

Chen, R., Yang, M., Weng, X., Choi, B., He, B., & Li, X. (2012). Improving large graph processing on partitioned graphs in the cloud. Paper presented at the Proceedings of the Third ACM Symposium on Cloud Computing.

Hendrickson, B., & Kolda, T. G. (2000). Graph partitioning models for parallel computing. Parallel computing, 26(12), 1519-1534.

Sakr, S., & Gaber, M. (2014). Large Scale and big data: Processing and Management: CRC Press.

Network Traffic Anomalies

Dr. Aly, O.
Computer Science

Introduction

Fraud detection is a critical component for the integrity of the Internet services (Huang, Al-Azzawi, & Brani, 2014; Sakr & Gaber, 2014; Soldo & Metwally, 2012).  The fraudulent activities include generating charges for online advertisers without a real interest in the products advertised (Sakr & Gaber, 2014; Soldo & Metwally, 2012).  Thess fraudulent activities are referred to as hit inflation attack or abusive ad clicks (Sakr & Gaber, 2014; Soldo & Metwally, 2012).  These fraudulent activities are classified into attacks from publishers and attacks from advertisers.   The goal of the attacks from the publishers is to increase the revenues of the publisher, while the goal of the attacks from advertisers is to increase the activities such as impressions or clicks associated with the advertisements of their competitors to deplete the advertising budget of the competitors (Sakr & Gaber, 2014; Soldo & Metwally, 2012). 

Such abusive ad clicks and hits inflation attacks must be detected for the integrity of the numerous internet services (Sakr & Gaber, 2014; Soldo & Metwally, 2012).  There are three approaches for generating abusive click attacks with three types of traffic.  The first approach is through ads on the publisher site which are clicked by legitimate users which are called white pointers.  The second approach is through ads which are clicked by both legitimate users and fraudsters which is called gray pointers.  The third traffic is through the large botnet to generate fake traffic (Sakr & Gaber, 2014; Soldo & Metwally, 2012).   Preventing such abusive traffic is very critical and is described to be “at the heart of analyzing large data sets” (Sakr & Gaber, 2014; Soldo & Metwally, 2012) because it involves developing statistical models at a global scale (Sakr & Gaber, 2014; Soldo & Metwally, 2012).  However, preventing or combating abusive traffic is not a trivial task and is a very challenging issue. 

IP Estimated Size Challenges

The IP size is defined in (Sakr & Gaber, 2014; Soldo & Metwally, 2012) as the number of users sharing the same IP address.  The size of any IP can change abruptly, as new users could join the local network and share the same public IP, and other users leave, or the IP address gets reassigned to a different host.  The same host could be shared among several users.  Moreover, the users could be connected through the same Network Address Translation (NAT).  The sizes of a significant portion of the IP space must be estimated, which is a very challenging task (Sakr & Gaber, 2014; Soldo & Metwally, 2012).

To preserve the users’ privacy, the sizes of IPs are estimated using the application-level log files (Sakr & Gaber, 2014; Soldo & Metwally, 2012).  However, this technique is not straightforward technique as there are various challenges associated with the application-level log files such as using distinct user identification, e.g., cookie IDs or user agents (UAs) per IP fails to accurately estimate sizes (Sakr & Gaber, 2014; Soldo & Metwally, 2012).   Thus, the estimation of the IP sizes using such approach of distinct user identification can either overestimate or underestimate the result (Sakr & Gaber, 2014; Soldo & Metwally, 2012).  When filtering the traffic based on these inaccurate sizes, the result can lead to high false-negative and false-positive rates (Sakr & Gaber, 2014; Soldo & Metwally, 2012).  Statistical models can be developed using the log files to estimate the IP sizes (Sakr & Gaber, 2014; Soldo & Metwally, 2012).  However, this statistical model approach has different challenges because it contains not only legitimate traffic but also abusive traffic which can result in degrading the quality of the statistical models and the estimated sizes (Sakr & Gaber, 2014; Soldo & Metwally, 2012).  To overcome such a challenge when using the statistical models, the models should be developed only from the traffic of trusted users, which can introduce sampling bias in the traffic (Sakr & Gaber, 2014; Soldo & Metwally, 2012).  To decrease such sampling bias in the estimation phase, the trusted traffic of each IP is only used during a period to estimate the size for that period (Sakr & Gaber, 2014; Soldo & Metwally, 2012). This specific period IP size estimation can reduce the accuracy of the filtering (Sakr & Gaber, 2014; Soldo & Metwally, 2012).

In (Soldo & Metwally, 2012), to overcome the above challenges, statistical models is proposed for size estimation in an autonomous, passive and privacy-preserving technique from aggregated log files, and predicted size using time series analysis on the estimated IP size (Soldo & Metwally, 2012). Thus, to estimate the IP size, a regression model is developed for the numbers of trusted cookies behind the IPs, the baseline of the measured sizes, using two types of features: (1) the activity rate, and (2) the explanatory diversity of the observed traffic (Soldo & Metwally, 2012).  Models are developed from the log files aggregated at the IP level.  The majority of the IPs have very few trusted cookies behind them.  Stratified sampling is used to avoid underrepresenting IPs with large measured sizes (Soldo & Metwally, 2012).   Estimates are calculated based on each IPs traffic rate and diversity (Soldo & Metwally, 2012).  A regression-based model is developed using four main regressions: (1) Linear Regression (LR), (2) Quantile Regression (QR), (3) Principal Component Analysis (PCA) & Multivariate Adaptive Regression Splines (MARS), and (4) Percentage Regression (PR) (Soldo & Metwally, 2012).  The LR model is commonly used regression technique which minimizes the root mean square error.  The QR is a more robust regression model that helps in the outliers.  The PCA+MARS technique is used to develop regression models for IP size estimation.  This technique uses a non-parametric regression technique which captures non-linear behavior by developing a piecewise nonlinear model (Soldo & Metwally, 2012).  The PR is a regression technique to minimize the relative error (Soldo & Metwally, 2012).  The accuracy of each model is evaluated and analyzed using the baseline against the result of each model.  The results showed no winning model.  Other alternative approaches can be used to predict the IP size such as autoregressive moving average (ARMA) model which is used to model time series with both autoregressive and moving an average part (Soldo & Metwally, 2012).  However, this model also faces many challenges. 

PredictSizes Algorithm Proposed Solution

Due to these challenges mentioned above, efficient prediction algorithm is required.  In (Soldo & Metwally, 2012), the PredictSizes algorithm is proposed to employ some concepts from seasonal autoregressive integrated moving average (ARIMA) models.  This ARIMA model is a general model of the ARM and is applied to non-stationary data with some trend or seasonality (Soldo & Metwally, 2012).  This model analyzes the periodicity of the size estimates (Soldo & Metwally, 2012).  For each periodicity, the model analyzes a sliding window of estimates and seeks their stable representative size by making iterative variance reduction until the estimates lie within an acceptable confidence interval.  The model also combines the estimates of all periodicities (Soldo & Metwally, 2012).  The model of PredictSizes deals with each periodicity of each IP separately.  Thus, it can be massively parallelized using the MapReduce framework as the estimates of the size are stored in files shared by the period IDs and IPs (Soldo & Metwally, 2012).  The algorithm of PredictSizes combines all the stable sizes of all the periodicities using a “Combiner” function which implements sanity checks on the predicted sizes (Soldo & Metwally, 2012).  The experimentation of (Soldo & Metwally, 2012) showed that this sanity checks proved to be very effective in detecting abrupt legitimate size changes early leading to the reduction of the false positives caused by over-filtering legitimate traffic (Soldo & Metwally, 2012).  The accuracy of the prediction is assessed and evaluated using a random sample the collected ten million IPs.  The result showed that the accuracy of the predictions increases when the estimated size increases, where the accuracy is more operationally desired (Soldo & Metwally, 2012). 

Machine-Generated Attacks Detection and IP Size Distribution

In (Sakr & Gaber, 2014; Soldo & Metwally, 2012), the emphasis is on the publishers hit inflation, and abusive ad clicks attacks. However, the techniques apply to the advertisers as well. These techniques are used to detect machine-generated traffic.  A framework is proposed by (Sakr & Gaber, 2014; Soldo & Metwally, 2012) which automatically detect and classifies the anomalous deviations using statistical tests.  The framework has low complexity and is said to be easy to parallelize, making it suitable for large-scale detection.  It is based on the fundamental characteristics of machine-generated traffic such as DHCP re-assignment.  The main goal of this proposed framework is to automatically detect and filter out the fraudulent clicks since the click traffic received by a publisher can be a mixture of both legitimate and fraudulent clicks (Sakr & Gaber, 2014; Soldo & Metwally, 2012).

The IP size is used as a discriminative feature for detecting machine-generated traffic (Sakr & Gaber, 2014; Soldo & Metwally, 2012).  Two main IP size distributions: (1) a website which receives average desktop traffic, and (2) a website which received average mobile traffic (Sakr & Gaber, 2014; Soldo & Metwally, 2012).   The researchers of (Soldo & Metwally, 2012) observed that the IP size is small when a website receives mainly desktop traffic where a small number of users share the same IP address. However, the IP size distribution is found to be highly skewed toward the left (Sakr & Gaber, 2014; Soldo & Metwally, 2012).   The IP size distribution exhibits two distinguished modes where the website receives mainly mobile traffic because the mobile users access the Internet using either public IP address or through large proxies (Sakr & Gaber, 2014; Soldo & Metwally, 2012).  There are two attacks identified by (Soldo & Metwally, 2012) as the two diverse examples in the wide spectrum of possible attacks using machine-generated traffic regarding resources required and sophistication level.  The Botnet-based attacks and the Proxy-based attacks.  The Botnet-based Attacks occur when the attacker controls a large number of hosts through a botnet, where the attack can be highly distributed across the available hosts to maximize the overall amount of traffic generated while maintaining a low activity profile for each host individually (Sakr & Gaber, 2014; Soldo & Metwally, 2012).  However, the Proxy-based attacks occur when the attacker controls a few hosts but still wants to generate a large amount of traffic, the attacker can use anonymizing proxies such as TOR (The Onion Router) nodes, to hide the actual source IPs involved in such traffic attack (Sakr & Gaber, 2014; Soldo & Metwally, 2012). 

The machine-generated traffic attacks induce an anomalous IP size distribution (Sakr & Gaber, 2014; Soldo & Metwally, 2012).  Thus, a detection system based on the IP size histogram is implemented which automatically filters fraudulent clicks associated with any publisher (Sakr & Gaber, 2014; Soldo & Metwally, 2012).  The first step is to identify the proper grouping of publishers, who share a similar IP size distribution (Sakr & Gaber, 2014; Soldo & Metwally, 2012).  The group is implemented by categorizing the publishers based on the same type of services such as web search, services for mobile users, content sites, and parked domain websites (Sakr & Gaber, 2014; Soldo & Metwally, 2012).  This approach provides fine-grained grouping technique of publishers which takes into account the various factors which can affect the IP size (Sakr & Gaber, 2014; Soldo & Metwally, 2012).  A statistical threshold model of the click traffic is computed for each group of publishers, by aggregating the click traffic, which is followed by setting a minimum quality score (Sakr & Gaber, 2014; Soldo & Metwally, 2012).  The percentile threshold is computed for each group and each bucket.  This technique considers the observed empirical distributions, the number of available samples IP sizes, and the desired confidence level (Sakr & Gaber, 2014; Soldo & Metwally, 2012).  The result showed that the proposed model could accurately estimate the fraud scores with three percentage average prediction error. 

Other Network Anomaly Detection Approaches

In (Huang et al., 2014), other approaches are discussed to include network anomaly detection focusing on non-signature-based approaches.  Three Non-Signature-Based approaches include three main approaches:  PCA-based, Sketch-based, and Signal-Analysis-Based.  In (Mahoney, 2003), two-stage anomaly detection system for identifying suspicious traffic.  The traffic is filtered to pass only the packets of most interest such as the first few packets of incoming service requests.  The most protocols of IP, TCP, Telnet, FTP, SMPT, and HTTP are modeled at the packet byte level to flag events using the byte values (Mahoney, 2003). 

References

Huang, H., Al-Azzawi, H., & Brani, H. (2014). Network traffic anomaly detection. arXiv preprint arXiv:1402.0856.

Mahoney, M. V. (2003). Network traffic anomaly detection based on packet bytes. Paper presented at the Proceedings of the 2003 ACM symposium on Applied computing.

Sakr, S., & Gaber, M. (2014). Large Scale and big data: Processing and Management: CRC Press.

Soldo, F., & Metwally, A. (2012). Traffic anomaly detection based on the IP size distribution. Paper presented at the INFOCOM, 2012 Proceedings IEEE.

Performance of IaaS Cloud and Stochastic Model

Dr. Aly, O.
Computer Science

Abstract

The purpose of this paper is to provide analysis of the Performance of IaaS Cloud with an emphasis on Stochastic Model.  The project begins with a brief discussion on the Cloud Computing and its Deployment Models of IaaS, PaaS, and SaaS. It also discusses the available three options for the performance analysis of the IaaS Cloud of the experiment-based, discrete event-simulation-based, and the stochastic model-based. The discussion focuses on the most feasible approach which is the stochastic model.  The discussion of the performance analysis also includes the proposed sub-models of the Resource Provisioning Decision Engine (RPDE) of CTMC, the Hot Physical Machine (PM) Sub-Model, the Closed-Form Solution for Hot PM Sub-Model, the Warm PM Sub-Model, and the Cold PM Sub-Model.  The discussion and the analysis also include the Interactions among these sub-models and the impact on the performance.   The Monolithic Model is also discussed and analyzed.  The findings of this discussion and analysis are addressed comparing the scalability and accuracy with the one-level monothetic model, and the accuracy of the interacting sub-models with the monolithic model.  The result also showed that when the number of PMs in each pool increased beyond three and the number of the VMs per PM increases beyond 38, the monolithic model runs into a memory overflow problem.  The result also indicated that the state space size of the monolithic model increases quickly and becomes too large to construct the reachability graph even for a small number of PMs and VMs.   When using the interacting sub-models, a reduced number of states and nonzero entries leads to a concomitant reduction in solution time needed. The findings of indicated that the values of the probabilities models (Ph, Pw, Pc) that at least one PM can accept a job in a pool are different in monolithic (“exact”) model and interacting (“approximate”) sub-models.

Keywords: IaaS Performance Analysis, Stochastic Model, Monolithic Model, CTMC.

Cloud Computing

Cloud Computing has attracted the attention of both the IT industry and the academia as it represents a new paradigm in computing and as a business model (Xiao & Xiao, 2013).  The key concept of the Cloud Computing is not new (Botta, de Donato, Persico, & Pescapé, 2016; Kaufman, 2009; Kim, Kim, Lee, & Lee, 2009; Zhang, Cheng, & Boutaba, 2010).  In accordance to (Kaufman, 2009) the technology of the Cloud Computing has been evolving for decades, “more than 40 years.”  Licklider introduced the term of “intergalactic computer network” back in the 1960s at the Advanced Research Projects Agency (Kaufman, 2009; Timmermans, Stahl, Ikonen, & Bozdag, 2010).   The term “cloud” goes back 1990s when the telecommunication world was emerging (Kaufman, 2009).  The virtual private network (VPN) services also got introduced with the telecommunication (Kaufman, 2009).  Although the VPN maintained the same bandwidth as “fixed networks,” the bandwidth efficiency got increased and the utilization of the network was balanced because these “fixed networks” supported “dynamic routing (Kaufman, 2009).  The telecommunication with the VPN and the bandwidth efficiency using dynamic routing resulted in technology that was coined the term “telecom cloud” (Kaufman, 2009).  The term of Cloud Computing is similar to the term “telecom cloud” as Cloud Computing also provides computing services using virtual environments that are dynamically allocated as required by consumers (Kaufman, 2009). 

Also, the underlying concept of the Cloud Computing was introduced by John McCarthy, the “MIT computer scientist and Turning aware winner,” in 1961  (Jadeja & Modi, 2012; Kaufman, 2009).  McCarthy predicted that “computation may someday be organized as a public utility” (Foster, Zhao, Raicu, & Lu, 2008; Jadeja & Modi, 2012; Joshua & Ogwueleka, 2013; Khan, Khan, & Galibeen, 2011; Mokhtar, Ali, Al-Sharafi, & Aborujilah, 2013; Qian, Luo, Du, & Guo, 2009; Timmermans et al., 2010).   Besides, Douglas F. Parkhill as cited in (Adebisi, Adekanmi, & Oluwatobi, 2014), in his book called “The Challenge of the Computer Utility” also predicted that the computer industry will provide similar services like the public utility “in which many remotely located users are connected via communication links to a central computing facility” (Adebisi et al., 2014).

NIST (Mell & Grance, 2011) identifies three essential Cloud Computing Service Models as follows:

  • layer provides the capability to the consumers to provision storage, processing, networks, and other fundamental computing resources.  Using IaaS, the consumer can deploy and run “arbitrary” software, which can include operating systems and application.  When using IaaS, the users do not manage or control the “underlying cloud infrastructure.”  However, the consumers have control over the storage, the operating systems, and the deployed application; and “possibly limited control of selected networking components such as host firewall” (Mell & Grance, 2011).
  • allows the Cloud Computing consumers to deploy applications that are created using programming languages, libraries, services, and tools supported by the providers.  Using PaaS, the Cloud Computing users do not manage or control the underlying cloud infrastructure including network, servers, operating systems, or storage. However, the consumers have control over the deployed applications and possibly configuration settings for the application-hosting environment (Mell & Grance, 2011).
  • allows Cloud Computing consumers to use the provider’s applications running on the cloud infrastructure.  Users can access the applications from various client devices through either a thin client interface, such as a web-based email from a web browser, or a program interface.  Using SaaS, the consumers do not manage or control the underlying cloud infrastructure including network, servers, operating systems, storage, or even individual application capabilities, with the possible exception of limited user-specific application configuration settings  (Mell & Grance, 2011).

Performance of IaaS Cloud

            The management of Big Data does require computing capacity.  This computing capacity requirement is met by the IaaS clouds which are regarded to be the major enabler of data-intensive cloud application (Ghosh, Longo, Naik, & Trivedi, 2013; Sakr & Gaber, 2014).  When using the IaaS Service Cloud Model, instances of Virtual Machines (VMs) which are deployed on physical machines (PMs) are provided to users for computing needs (Ghosh et al., 2013; Sakr & Gaber, 2014).  Providing the basic functionalities for processing Big Data is important.  However, the performance of the Cloud is regarded to be another important factor (Ghosh et al., 2013; Sakr & Gaber, 2014).  IaaS cloud providers offer Service Level Agreement (SLA) to guarantee availability (Ghosh et al., 2013; Sakr & Gaber, 2014). However, performance SLA is as important as the availability SLA (Ghosh et al., 2013; Sakr & Gaber, 2014).  Performance analysis of the Cloud is complex process because performance is impacted by various things such as the hardware components of CPU speed, disk properties, or software such as the nature of hypervisor, or the workload such the arrival rate, or the placement policies (Ghosh et al., 2013; Sakr & Gaber, 2014). 

            There are three major techniques which can be used to evaluate the performance of the Cloud (Ghosh et al., 2013; Sakr & Gaber, 2014).  The first technique involves the experimentation for measurement-based performance quantification (Ghosh et al., 2013; Sakr & Gaber, 2014). However, this approach is not a practical approach due to the scale of the cloud which becomes prohibitive in term of time and cost when using this measurement-based analysis (Ghosh et al., 2013; Sakr & Gaber, 2014).  The second approach involves discrete event simulation (Ghosh et al., 2013; Sakr & Gaber, 2014).  However, this approach is not practical approach either because the simulation can take a long time to provide statistically significant results (Ghosh et al., 2013; Sakr & Gaber, 2014).  The third approach is the stochastic technique which can be used as a low-cost option where the model solution time is much less the experimental approach and the simulation approach (Ghosh et al., 2013; Sakr & Gaber, 2014).  However, with the stochastic approach, the cloud may not scale giving the complexity and the size of the Cloud (Ghosh et al., 2013; Sakr & Gaber, 2014).  Scalable stochastic modeling approach which can preserve accuracy is important (Ghosh et al., 2013; Sakr & Gaber, 2014).  

As indicated in (Ghosh et al., 2013; Sakr & Gaber, 2014), three pools identified for the Cloud architecture; hot, warm and cold. The hot pool is the busy and running pool (running status), while the warm pool is turned on but not ready (turned on but not ready status) and it is saving power, and the cold pool is turned off (turned off status) (Ghosh et al., 2013; Sakr & Gaber, 2014). There is no delay with the hot pool, while there is a little delay in the warm pool and the delay gets increased with the cold pool (Ghosh et al., 2013; Sakr & Gaber, 2014).  When a request arrived, the Resource Provisioning Decision Engine (RPDE) tried to find a physical machine from the hot pool, which can accept the request (Ghosh et al., 2013; Sakr & Gaber, 2014).  However, if all machines are all busy in the hot pool, the RPDE tries to find a physical machine from the warm pool (Ghosh et al., 2013; Sakr & Gaber, 2014).  If the warm pool can not meet the request, the RPDE will go to the cold pool to meet that request (Ghosh et al., 2013; Sakr & Gaber, 2014). 

There are interacting sub-models for performance analysis.  A scalable approach using interacting stochastic sub-models are proposed where iteration composes an overall solution over individual sub-model solutions (Ghosh et al., 2013; Sakr & Gaber, 2014).  

  1. RPDE Sub-Model of the Continuous-Time MarkovChains (CTMC)

The first model is the RPDE sub-model of the Continuous-Time Markov Chains (CTMC) which is designed to capture the resource providing decision process (Ghosh et al., 2013; Sakr & Gaber, 2014).   In this submodel, a finite length decision queue is considered where decisions are made on a first-come, first-serve (FMFS) basis (Ghosh et al., 2013; Sakr & Gaber, 2014).  Under this sub-model, there is a closed form solution for RPDE sub-model and VM provisioning sub-model solutions.

1.1 The Closed Form Solution for RPDE Sub-Model

Using this closed form sub-model, a numerical solution can be obtained in two steps which start with some value of π(0,0), and compute all the state probabilities as a function of π(0,0) (Ghosh et al., 2013; Sakr & Gaber, 2014). The second step includes the actual steady state probability which gets calculated and normalized (Ghosh et al., 2013; Sakr & Gaber, 2014).  The calculation of the steady state is found in (Ghosh et al., 2013; Sakr & Gaber, 2014).   Using the Markov reward approach, the outputs from the RPDE sub-model are obtained by appropriate reward rate assigned to each state of the CTMC and then computing the expected reward rate in the steady state (Ghosh et al., 2013; Sakr & Gaber, 2014).   There are three scenarios for the outputs from this RPDE sub-model:  The job rejection probability, the mean queuing delay, and the mean decision delay.  Each of these outputs has its calculations which can be found in details in (Ghosh et al., 2013; Sakr & Gaber, 2014).  

1.2 The VM Provisioning Sub-Models

The VM provisioning sub-models capture the instantiation, configuration, and provision of a VM on a physical machine (PM) (Ghosh et al., 2013; Sakr & Gaber, 2014).  For each hot, warm, and cold physical machine pool, there is CTMC which keeps track of the number of assigned and running VMs (Ghosh et al., 2013; Sakr & Gaber, 2014).  The VM provisioning sub-models include various sub-models: (1) the hot PM sub-model, (2) the closed form solution for hot PM sub-model, (3) the warm PM sub-model, and (4) the cold PM sub-model (Ghosh et al., 2013; Sakr & Gaber, 2014). 

1.2.1 The Hot PM Sub-Model

The hot PM sub-model include the overall hot pool which is modeled by a set of independent hot PM sub-models (Ghosh et al., 2013; Sakr & Gaber, 2014). The VMs are assumed to be provisioned serially (Ghosh et al., 2013; Sakr & Gaber, 2014).

1.2.2 The Closed-Form Solution for Hot PM Sub-Model

The closed form solution for hot PM sub-model is derived for the steady state probabilities of the hot PM CTMC where the hot PM is modeled as a two-stage tandem network of queues (Ghosh et al., 2013; Sakr & Gaber, 2014).  In the closed form solution for hot PM sub-model, the queuing system consists of two nodes (1) node A , and node B.  Node A has only one server with service rate of βh , while Node B has infinite servers with service rate of each server of µ (Ghosh et al., 2013; Sakr & Gaber, 2014).  The server in node A denotes the provisioning engine within the PM while the servers in node B denote the running VMs.  The service time distribution at both nodes A and B is exponential (Ghosh et al., 2013; Sakr & Gaber, 2014).  The calculation for the external arrival process is demonstrated in (Ghosh et al., 2013; Sakr & Gaber, 2014).  If the buffer of PM is full, it cannot accept a job for provisioning (Ghosh et al., 2013; Sakr & Gaber, 2014).  The steady state probability can be computed after solving the hot PM sub-model (Ghosh et al., 2013; Sakr & Gaber, 2014). 

1.2.3 The Warm PM Sub-Model

In the warm PM sub-model, there are three main differences from the hot PM sub-model.  The effective arrival rate is the first difference.  In the warm PM sub-mode, the effective arrival rate is different because jobs arrive at the warm PM pool only if they are not provisioned on any of the hot PMs (Ghosh et al., 2013; Sakr & Gaber, 2014). The second difference is the time required to provision VM.   When there is no VM running or being provisioning, warm PM is turned on but not ready for use yet. Upon a job arrival in this state, the warm PM requires some additional time for startup which causes delay to make it ready to use (Ghosh et al., 2013; Sakr & Gaber, 2014).  The time to make a warm PM ready for use is assumed to be exponential.  The third difference is the mean time to provision a VM on a warm PM is 1/βw for the first VM to be deployed on this PM.  The mean time to provision VMs for subsequent jobs is the same as that for a hot PM (Ghosh et al., 2013; Sakr & Gaber, 2014).  After solving the warm PM sub-model, the steady-state probability is computed detailed in (Ghosh et al., 2013; Sakr & Gaber, 2014).

1.2.4 The Cold PM Sub-Model

The cold PM sub-model had differences from the hot and cold PM sub-models discussed above (Ghosh et al., 2013; Sakr & Gaber, 2014). The effective arrival rate, the rate at which startup is executed, and the initial VM provisioning rates and the buffer sizes (Ghosh et al., 2013; Sakr & Gaber, 2014).  In (Ghosh et al., 2013; Sakr & Gaber, 2014), the computations for these factors are provided in details.   

Once the job is successfully provisioned using either hot, cold or warm, the job utilizes the resources until the execution of the job is completed (Ghosh et al., 2013; Sakr & Gaber, 2014).  The run-time sub-model is utilized to determine the mean time for job completion.  The Discrete Time Markov Chain (DTMC) is used to capture the details of a job execution (Ghosh et al., 2013; Sakr & Gaber, 2014).  The job can complete its execution with a probability of P0 or go for some local I/O operations with a probability of ( 1 – P0 ) (Ghosh et al., 2013; Sakr & Gaber, 2014).  The full calculation is detailed in (Ghosh et al., 2013; Sakr & Gaber, 2014).

2. The Interactions Among Sub-Models

The sub-models discussed above can interact.  The interactions among these sub-models are illustrated in Figure 1, adapted from (Ghosh et al., 2013).

Figure 1:  Interactions among the sub-models, adapted from (Ghosh et al., 2013).

In (Ghosh et al., 2013), this interaction is discussed briefly.  The run-time sub-model yields the mean service time (1/µ) which is needed as an input parameter to each type; hot, warm, or cold of the VM provisioning sub-model (Ghosh et al., 2013).  The VM provisioning sub-models compute the steady state probabilities as (Ph, Pw, and Pc) which at least on PM in a hot pool, warm pool, or cold pool respectively can accept a job for provisioning (Ghosh et al., 2013).  These probabilities are used as input parameters to the RPDE sub-model (Ghosh et al., 2013).  From the RPDE sub-model, rejection probability due to buffer full as (Pblock), or insufficient capacity (Pdrop), and their sum (Preject) are obtained (Ghosh et al., 2013).  This (Pblock) is an input parameter to the three VM provisioning sub-models discussed above.  Moreover, the Mean Response Delay (MRD) is computed from the overall performance model (Ghosh et al., 2013).  There are two components of the MRD; Mean Queuing Delay (MQD) in RPDE, and Mean Decision Delay (MDD) which are obtained from the RPDE sub-model (Ghosh et al., 2013).  Two more components are calculated; MQD in a PM and Mean Provisioning Delay (MPD) are obtained from VM provisioning sub-models (Ghosh et al., 2013). There are dependencies among the sub-models.  The (Pblock) which is computed in the RPDE sub-model is utilized as an input parameter in VM provisioning sub-models (Ghosh et al., 2013).  However, to solve the RPDE sub-model, outputs from VM provisioning sub-models (Ph, Pw, Pc) are required as input parameters (Ghosh et al., 2013).  This cyclic dependency issue is resolved by using fixed-point iteration using a variant of the successive substitution method (Ghosh et al., 2013).  

3. The Monolithic Model

            In (Ghosh et al., 2013), a monolithic model for IaaS cloud is constructed using the variant of stochastic Petric Net (SPN) called stochastic reward net (SRN) (Ghosh et al., 2013).  In this model, the SRN is used to construct a monolithic model for IaaS Cloud (Ghosh et al., 2013).  The SRNs are extensions of GSPNs (Generalized Stochastic Petri Nets) (Ajmone Marsan, Conte, & Balbo, 1984) and the key features of SRNs are:

  • (Ghosh et al., 2013). 

Using this monolithic model, the findings of (Ghosh et al., 2013) showed that the outputs were obtained by assigning an appropriate reward rate to each marking of the SRN and then computing the expected reward rate in the steady state.  The measures that were used by (Ghosh et al., 2013) are the Job Rejection Probability (Preject), the Mean Number of Jobs in the RDPE (E(NRPDE)).  The (Preject) has two components as discussed earlier (Pblock) which is rejection probability due to buffer full, and (Pdrop), which insufficient capacity (Ghosh et al., 2013), when the RPDE buffer is full and when all (hot, warm, cold) PMs are busy respectively (Ghosh et al., 2013).  The (E(NRPDE)), which is a measure of mean response delay, is given by the sum of the number of jobs that are waiting in the RPDE queue and the job that is currently undergoing provisioning decision (Ghosh et al., 2013). 

4. The Findings

In (Ghosh et al., 2013; Sakr & Gaber, 2014), the SHARP software package is used to solve the interacting sub-models to compute two main calculations: (1) the Job Rejection Probability, and (2) the Mean Response Delay (MRD) (Ghosh et al., 2013; Sakr & Gaber, 2014).  The result of (Ghosh et al., 2013; Sakr & Gaber, 2014) showed that the job rejection probability gets increased with longer Mean Service Time (MST).  Moreover, if the PM capacity in each pool is increased, the job rejection probability gets reduced at a given value of mean service time (Ghosh et al., 2013; Sakr & Gaber, 2014).   The result also showed that with the increasing MST, the MRD increased for a fixed number of PMs in each pool (Ghosh et al., 2013; Sakr & Gaber, 2014).   

In comparison with one-level monolithic model, the scalability and accuracy of the proposed approach by (Ghosh et al., 2013; Sakr & Gaber, 2014), the result also showed that when the number of PMs in each pool increased beyond three and the number of the VMs per PM increases beyond 38, the monolithic model runs into a memory overflow problem (Ghosh et al., 2013; Sakr & Gaber, 2014).  The result also indicated that the state space size of the monolithic model increases quickly and becomes too large to construct the reachability graph even for a small number of PMs and VMs (Ghosh et al., 2013; Sakr & Gaber, 2014).   The findings of (Ghosh et al., 2013; Sakr & Gaber, 2014) also showed that the non-zero elements in the infinitesimal generator matrix of the underlying CTMC of the monolithic model are hundreds to thousands in orders of magnitude larger compared with the interacting sub-models for a given number of PMs and VMs.  When using the interacting sub-models, a reduced number of states and nonzero entries leads to a concomitant reduction in solution time needed (Ghosh et al., 2013; Sakr & Gaber, 2014). As demonstrated by (Ghosh et al., 2013; Sakr & Gaber, 2014), the solution time for monolithic model increased almost exponentially with the increase in model size, while the solution time for interacting sub-models remains almost constant with the increase in model size.  Thus, the findings of (Ghosh et al., 2013; Sakr & Gaber, 2014) indicated that the proposed approach is scalable and tractable compared with the one-level monolithic model. 

In comparison with the monolithic modeling approach, the accuracy of interacting sub-models showed when the arrival rate and maximum number of VMs per PM is changed, the outputs obtained from both the modeling approaches are near similar using the two performance measures of the Job Rejection and Mean Number of Jobs in RPDE (Ghosh et al., 2013; Sakr & Gaber, 2014).   Thus, the errors introduced by the decomposition of the monolithic model are negligible, and interacting sub-models approach preserves accuracy while being scalable (Ghosh et al., 2013; Sakr & Gaber, 2014).   These errors are the result of solving only one model for all the PMs in each pool, and the aggregation of the obtained results to approximate the behavior of the pool as a whole (Ghosh et al., 2013; Sakr & Gaber, 2014).  The findings of (Ghosh et al., 2013; Sakr & Gaber, 2014) indicated that the values of the probabilities models (Ph, Pw, Pc) that at least one PM can accept a job in a pool are different in monolithic (“exact”) model and interacting (“approximate”) sub-models (Ghosh et al., 2013; Sakr & Gaber, 2014).  

Conclusion

The purpose of this project was to provide analysis of the Performance of IaaS Cloud with an emphasis on Stochastic Model.  The project began with a brief discussion on the Cloud Computing and its Deployment Models of IaaS, PaaS, and SaaS.  It also discussed the available three options for the performance analysis of the IaaS Cloud of the experiment-based, discrete event-simulation-based, and the stochastic model-based. The discussion focused on the most feasible approach which is the stochastic model.  The discussion of the performance analysis also included the proposed sub-models of RPDE of CTMC, which the Hot PM Sub-Model, the Closed-Form Solution for Hot PM Sub-Model, the Warm PM Sub-Model, and the Cold PM Sub-Model.  The discussion and the analysis also included the Interactions among these sub-models and the impact on the performance.   The Monolithic Model was also discussed and analyzed.  The findings of this analysis are addressed comparing the scalability and accuracy of them with the one-level monothetic model, and the accuracy of the interacting sub-models with the monolithic model.  The result also showed that when the number of PMs in each pool increased beyond three and the number of the VMs per PM increases beyond 38, the monolithic model runs into a memory overflow problem.  The result also indicated that the state space size of the monolithic model increases quickly and becomes too large to construct the reachability graph even for a small number of PMs and VMs.   The findings of also showed that the non-zero elements in the infinitesimal generator matrix of the underlying CTMC of the monolithic model are hundreds to thousands in orders of magnitude larger compared with the interacting sub-models for a given number of PMs and VMs.  When using the interacting sub-models, a reduced number of states and nonzero entries leads to a concomitant reduction in solution time needed(Ghosh et al., 2013; Sakr & Gaber, 2014). As demonstrated by, the solution time for monolithic model increased almost exponentially with the increase in model size, while the solution time for interacting sub-models remains almost constant with the increase in model size.  Thus, the findings indicated that the proposed approach is scalable and tractable compared with the one-level monolithic model.  The findings of (Ghosh et al., 2013; Sakr & Gaber, 2014)indicated that the values of the probabilities models (Ph, Pw, Pc) that at least one PM can accept a job in a pool are different in monolithic (“exact”) model and interacting (“approximate”) sub-models.

References

Adebisi, A. A., Adekanmi, A. A., & Oluwatobi, A. E. (2014). A Study of Cloud Computing in the University Enterprise. International Journal of Advanced Computer Research, 4(2), 450-458.

Ajmone Marsan, M., Conte, G., & Balbo, G. (1984). A class of generalized stochastic Petri nets for the performance evaluation of multiprocessor systems. ACM Transactions on Computer Systems (TOCS), 2(2), 93-122.

Botta, A., de Donato, W., Persico, V., & Pescapé, A. (2016). Integration of Cloud Computing and Internet Of Things: a Survey. Future Generation computer systems, 56, 684-700.

Foster, I., Zhao, Y., Raicu, I., & Lu, S. (2008). Cloud Computing and Grid Computing 360-Degree Compared. Paper presented at the 2008 Grid Computing Environments Workshop.

Ghosh, R., Longo, F., Naik, V. K., & Trivedi, K. S. (2013). Modeling and performance analysis of large-scale IaaS clouds. Future Generation computer systems, 29(5), 1216-1234.

Jadeja, Y., & Modi, K. (2012). Cloud Computing-Concepts, Architecture and Challenges. Paper presented at the Computing, Electronics and Electrical Technologies (ICCEET), 2012 International Conference on.

Joshua, A., & Ogwueleka, F. (2013). Cloud Computing with Related Enabling Technologies. International Journal of Cloud Computing and Services Science, 2(1), 40. doi:10.11591/closer.v2i1.1720

Kaufman, L. M. (2009). Data Security in the World of Cloud Computing. IEEE Security & Privacy, 7(4), 61-64.

Khan, S., Khan, S., & Galibeen, S. (2011). Cloud Computing an Emerging Technology: Changing Ways of Libraries Collaboration. International Research: Journal of Library and Information science, 1(2).

Kim, W., Kim, S. D., Lee, E., & Lee, S. (2009). Adoption Issues for Cloud Computing. Paper presented at the Proceedings of the 7th International Conference on Advances in Mobile Computing and Multimedia.

Mell, P., & Grance, T. (2011). The NIST Definition of Cloud Computing.

Mokhtar, S. A., Ali, S. H. S., Al-Sharafi, A., & Aborujilah, A. (2013). Cloud Computing in Academic Institutions. Paper presented at the Proceedings of the 7th International Conference on Ubiquitous Information Management and Communication.

Qian, L., Luo, Z., Du, Y., & Guo, L. (2009). Cloud Computing: an Overview. Paper presented at the IEEE International Conference on Cloud Computing.

Sakr, S., & Gaber, M. (2014). Large Scale and Big Data: Processing and Management: CRC Press.

Timmermans, J., Stahl, B. C., Ikonen, V., & Bozdag, E. (2010). The Ethics of Cloud Computing: A Conceptual Review.

Xiao, Z., & Xiao, Y. (2013). Security and Privacy in Cloud Computing. IEEE Communications Surveys & Tutorials, 15(2), 843-859.

Zhang, Q., Cheng, L., & Boutaba, R. (2010). Cloud Computing: State-of-the-Art and Research Challenges. Journal of internet services and applications, 1(1), 7-18.

NoSQL Data Storage System

Dr. Aly, O.
Computer Science

Introduction:  For decades, the traditional database such as MySQL, PostgreSQL, SQL Server and Oracle are regarded to be a one-size-fits-all approach for data persistence and retrieval (Sakr & Gaber, 2014). However, these traditional databases are challenged by the increasing demand for scalability, the requirement for new applications, and some web-scale applications (Sakr & Gaber, 2014).  The most common architecture to develop enterprise web application is based on the three-tier framework: the server layer, the application layer, and the data layer (Sakr & Gaber, 2014).  The data partitioning and the data replication are two commonly used approaches to achieve the availability, scalability, and performance enhancement goals in the distributed data management.  There are two main approaches to achieve scalability at the database layer to be able to handle the client requests when the load of the application is increased (Sakr & Gaber, 2014).  The first approach is to scale up allocating a bigger machine to act as database servers. The second approach is to scale out replicating and partitioning data across more machines (Sakr & Gaber, 2014). However, the traditional database suffers from serious limitations.  Database systems are not easy to scale as they cannot exceed a certain limit.  The database systems are not easy to configure and maintain.  The specialized database systems for main memory systems as the case with OLTP and column stores as the case with OLAP add more complication and cost when selecting the database system in addition to the peak provisioning unnecessary cost (Sakr & Gaber, 2014).

Thus, new systems called NoSQL started to emerge as an alternative mode for the traditional database systems to be able to deal and handle Big Data (Moniruzzaman & Hossain, 2013; Pokorny, 2013; Sakr & Gaber, 2014).    Not Only SQL” known as NoSQL databases emerged to deal with Big Data.  NoSQL database systems were developed by major internet companies such as Facebook, Amazon, and Google, when they were confronted with the Big Data challenges (Moniruzzaman & Hossain, 2013).  NoSQL databases are found to be suitable for massive scheme-free datasets for Big Data management (Hu, Wen, Chua, & Li, 2014).  NoSQL database systems are considered to be the potential data management solution for Big Data (Abbasi, Sarker, & Chiang, 2016). 

NoSQL Data Storage and the Tradeoff between Consistency and Availability

The ACID properties are regarded to be one of the basic features of the traditional relational databases (Moniruzzaman & Hossain, 2013; Pokorny, 2013; Sakr & Gaber, 2014).  ACID stands for “Atomicity,” “Consistency,” “Isolation,” and “Durability” (Pokorny, 2013).  These ACID properties indicate “all or nothing” concept behind the traditional database (Pokorny, 2013).  The relational database has been full compliance with ACID principle (Pokorny, 2013).  In addition to the ACID properties, there is also CAP theorem which states that for any system sharing data it is impossible to guarantee all of these three properties simultaneously (Pokorny, 2013).  These three properties of CAP include “consistency,” “availability,” and “partition tolerance” (Pokorny, 2013; Sakr & Gaber, 2014).  Moreover, the traditional relational database is also characterized by a schema, where data is structured in tables, tuples, and fields (Moniruzzaman & Hossain, 2013; Sadalage & Fowler, 2013).  The traditional consistency model is not adequate for distributed systems such as the Cloud environment (Sakr & Gaber, 2014).  

There are two major consistency models; the strong consistency which includes the linearizability and serializability, and weak consistency which includes the eventual the causal, eventual, and timeline consistency model (Sakr & Gaber, 2014).  The causal consistency model ensures total ordering between operations which have causal relations. The eventual consistency model ensures all replicas will gradually and eventually become consistent in the absence of updates (Sakr & Gaber, 2014). The timeline consistency model guarantees all replicas perform operations on one record in the same “correct order” (Sakr & Gaber, 2014).

As indicated in (Pokorny, 2013), the NoSQL database systems scale nearly linearly with the number of servers used (Pokorny, 2013). The reason for such capability for scaling nearly linearly is due to the use of “data partitioning” (Pokorny, 2013).  In NoSQL database systems, the method of distributed hash tables (DHT) is often used, in which couples of (key, value) are hashed into buckets – partial storage spaces, each from that placed in a node (Pokorny, 2013). NoSQL is not characterized by a schema or structured data (Hu et al., 2014; Sadalage & Fowler, 2013).  NoSQL systems are fast, highly scalable, and reliable (Hu et al., 2014). The term of “NoSQL” database indicates the loosely specified class of non-relational data stores (Pokorny, 2013).  NoSQL databases mostly do not use SQL as their query language (Pokorny, 2013).  They do not support operations of “JOIN” and “ORDER BY.”  The reason is that because portioning data is done horizontally (Pokorny, 2013).  The data in NoSQL is often organized into tables on a logical level and accessed only through the Primary Key (Pokorny, 2013).

NoSQL database systems are organized by data models (Hu et al., 2014).  They are categorized as (1) key-value stores, (2) column-oriented databases, and (3) document databases (Hu et al., 2014).  Most NoSQL database systems are key-value stores or big hash tables, which contain a pair of the key-value dataset (Pokorny, 2013).  This approach of the key-value or big hash table increases the efficiency of the lookup (Pokorny, 2013).  The key uniquely identifies a value typically a string but it can also be a pointer, where the value is stored.  The value can be structured or completely unstructured typically in BLOB (binary large object) format (Pokorny, 2013).  The pair of key-value can be of different types, and may not come from the same table (Pokorny, 2013).  These characteristics of the NoSQL database using the pair of key-value concept, increase efficiency and scalability of the NoSQL database systems (Pokorny, 2013).  Column-oriented databases store and process data by column instead of by row (Hu et al., 2014).  The rows and columns will get split over multiple nodes to achieve scalability (Hu et al., 2014).   The document-oriented databases support more complex data structures than the key-value stores (Hu et al., 2014).  The document-oriented database systems are the most general models of the NoSQL databases (Pokorny, 2013). There are other data models for NoSQL dataset systems, including the graph databases that are not discussed in this paper.  Table 1 illustrates some of these data models of the NoSQL databases reflecting the name of the databases for each model, producer, CAP option, and consistency, derived from (Hu et al., 2014).

Table 1:  NoSQL Database Models. Adapted from (Hu et al., 2014)

In accordance (Hu et al., 2014; Moniruzzaman & Hossain, 2013; Pokorny, 2013), some of these NoSQL databases do not implement ACID fully, and can only be eventually consistent (Hu et al., 2014; Moniruzzaman & Hossain, 2013; Pokorny, 2013).  NoSQL databases implement “eventual consistency” concept instead of “strong consistency,” where any updates and changes are replicated to the entire database eventually, but at any given time (Hu et al., 2014; Moniruzzaman & Hossain, 2013; Pokorny, 2013).  The “eventually consistent” term means that the system will eventually become consistent but after some time (Hu et al., 2014; Moniruzzaman & Hossain, 2013; Pokorny, 2013).  This principle of “eventual consistency” indicate more availability and greatly improve scalability at the expense of the full and immediate consistency (Hu et al., 2014; Moniruzzaman & Hossain, 2013; Pokorny, 2013).  NoSQL database has particular architectures that use different possibilities of distribution, ensuring the availability of the data, and the access to the data using replication techniques.   Figure 1 illustrates the characteristics of NoSQL databases, derived from (Moniruzzaman & Hossain, 2013).

Figure 1: Characteristics of NoSQL databases. Adapted from (Moniruzzaman & Hossain, 2013)

In accordance to (Chen & Zhang, 2014), the most popular NoSQL database is Apache Cassandra.  Facebook in 2008 released Cassandra as open source (Chen & Zhang, 2014).  Other NoSQL implementations include Apache Hadoop, MapReduce, MemcacheDB, and Voldemort (Chen & Zhang, 2014). 

References

Abbasi, A., Sarker, S., & Chiang, R. (2016). Big data research in information systems: Toward an inclusive research agenda. Journal of the Association for Information Systems, 17(2), 3.

Chen, C. P., & Zhang, C.-Y. (2014). Data-intensive applications, challenges, techniques, and technologies: A survey of Big Data. Information Sciences, 275, 314-347.

Hu, H., Wen, Y., Chua, T.-S., & Li, X. (2014). Toward scalable systems for big data analytics: A technology tutorial. IEEE Access, 2, 652-687.

Moniruzzaman, A., & Hossain, S. A. (2013). NoSQL database: New era of databases for big data analytics-classification, characteristics, and comparison. arXiv preprint arXiv:1307.0191.

Pokorny, J. (2013). NoSQL databases: a step to database scalability in a web environment. International Journal of Web Information Systems, 9(1), 69-82.

Sadalage, J. P., & Fowler, M. (2013). NoSQL: A Brief Guide to the Emerging World of Polyglot Persistence (1st Edition ed.): Addison-Wesley.

Sakr, S., & Gaber, M. (2014). Large Scale and big data: Processing and Management: CRC Press.