"Artificial Intelligence without Big Data Analytics is lame, and Big Data Analytics without Artificial Intelligence is blind." Dr. O. Aly, Computer Science.
An important aspect of analyzing time-based data is finding trends.
From a reporting perspective, a trend may be just a smooth LASSO curve on the data points or just a line chart connection data points spread over time.
From an analytics perspective the trend can have different interpretations.
You will learn:
How to install AdventureWorks Sample Database into SQL Server.
How to export certain data from SQL Server to Excel.
How to load the Excel into PowerBI and analyze trends in data using PowerBI Desktop version.
Step-by-Step Instruction
Step-1: Install the AdventureWorks Sample Database
You will have a copy of the files with this workshop.
Step-2: Import the Backup file into SQL Server.
Import the backup file into SQL Server.
After importing the AdventureWorks into SQL server, you will have the database as follows.
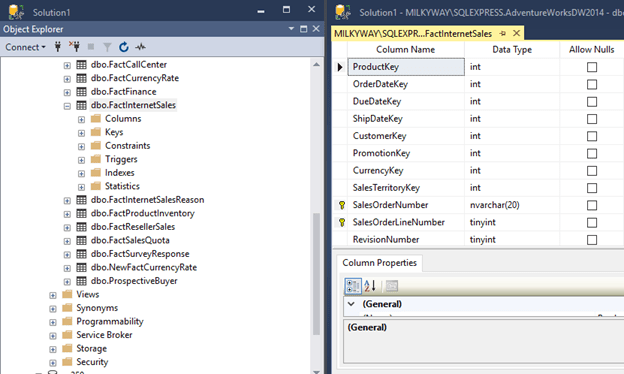
Step-3: Locate the Table dbo.FactInternetSales
This database has a number of tables to populate Power BI with the sample data.
We will be using the FactInternetSale table.
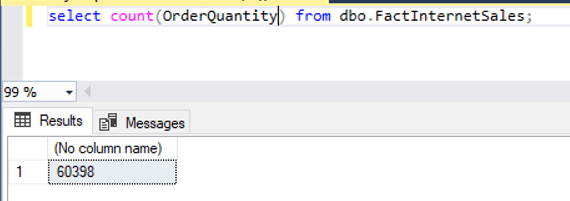
Step-4: Retrieve the total number of the records
Issue select statement to see how many rows in the table.
There are 60,398 records.
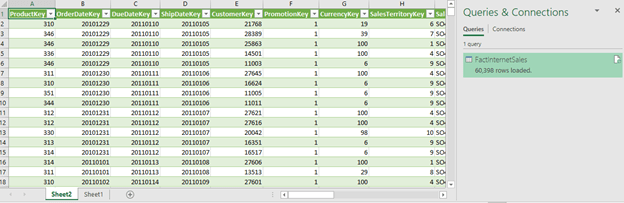
Step-5: Import the Table Content into Excel
Open Up Excel
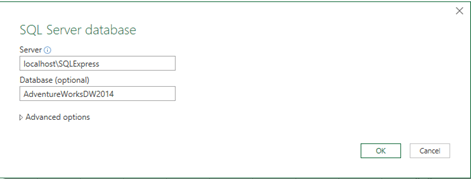
Click on Data à Get Data à SQL Server.
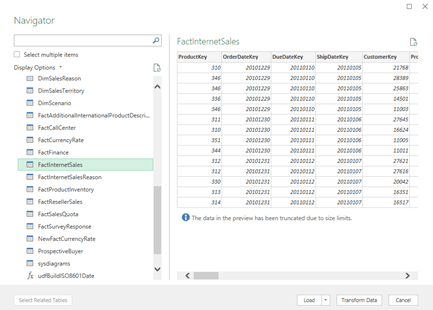
After loading the table in the Excel file, you will get something like the following.
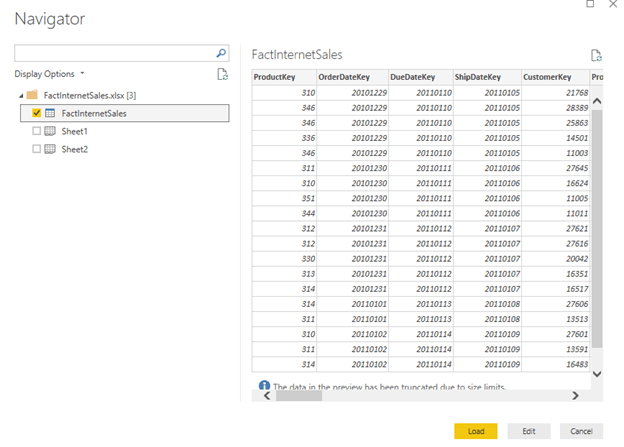
Step-5: Import Excel Into Power BI
Get Data
Select Excel
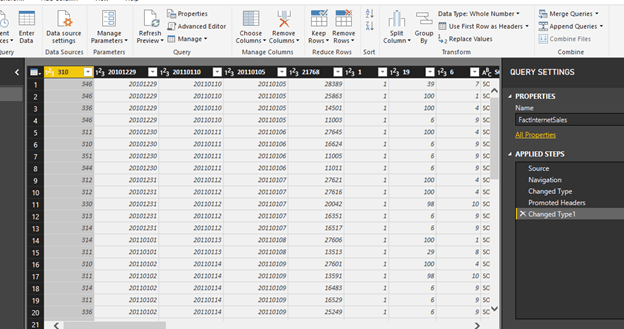
Step-6: Click Edit and Select Use First Row as Header
Click on Load.
Click Close and Apply
Step-7: Select the Desire Fields and Set up Their Properties
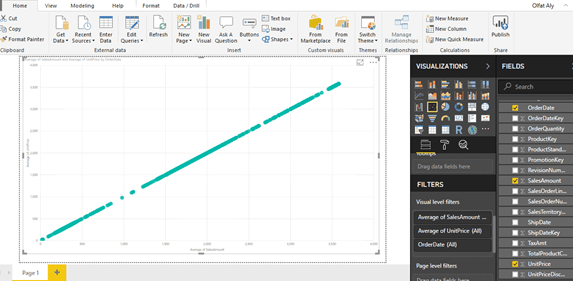
One standard method of analyzing two numerical values on a graph is by using scatterplot graph.
In a scatterplot graph, each value has an X-axis, and Y-axis is plotted on the graph using the values of two scales.
You will use the fields as Average of UnitPrice and Average of SalesAmount.
You also want to see this comparison over time, so you will add the OrderDate field in the Details section.
Select OrderDate, SalesAmount, UnitPrice.
Select Average of SalesAmount.
Select Average of UnitPrice.
Select OrderDate from OrderDate instead of Date Hierarchy.
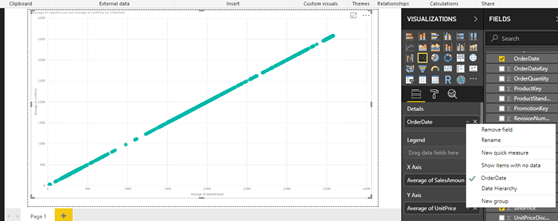
Select the scatterplot icon from the visualizations pane and create a blank scatterplot graph on the report layout.
Select his blank graph, and add the fields as discussed above.
This will create a scatterplot chart of average of unit price vs. average of sales amount over time.
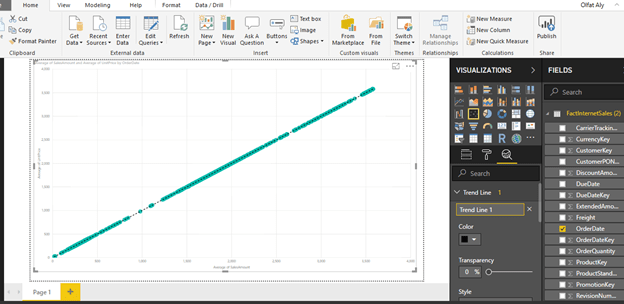
Step-8: Add a Trend Line
The chart seems to show linear relationship as the points seems to be organized in a straight line, but you cannot be sure just by reviewing visually.
The chart seems to show a series of points that are closely overlaid near or on the top of each other.
You need an explicit indicator of the same, like a project trend line in the graph.
To accomplish the same, click on Analytics Icon/Pane and you should find a trend-line option as shown below.
Click and Add to create a new trend line.
You can format the different options as shown below.
After adding the trend line, the graph should look as shown below.
This looks very trivial as you can create a trend using a line chart.
However, this trend is more like a linear trend line used in a linear regression method where the best-fit line passes through the minimum of squares distance/variance from all the points in the plot.
Linear regression analysis is part of statistical analysis which is part of machine learning techniques.
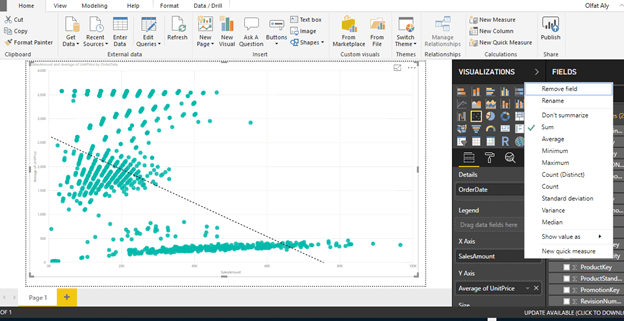
Step-9: Use Different Aggregation instead of Average Sales
You can try a different aggregation to look at a different trend.
Instead of the average of Sales Amount, change the aggregation to Sum of the Sales Amount.
To change the aggregation, you need to right-click on the field, and select the aggregation of choice from the menu as shown below.
Select Sum for Sales Amount
After making the change, the trend would look as shown below.
This shows that the trend is negative.
As the average of unit price decreases, the sum of sales amount increases.
From this limited trend analysis, without looking at the data, you can make an initial assumption that as the average of unit price of products increases, the sum total of overall sales decreases, but the average of sales increases.
This indicates that for expensive products the total sales is low.
As the number of products sold are less and the unit price is high, the average keeps on increasing shown a linear positive trend.
In this way, trend line enables quick interpretation of the data using different aggregations with trend lines.
The purpose of this project is to analyze a dataset using the correlation analysis and correlation plot in PowerBI.
Correlation Analysis is a fundamental method of exploratory data analysis to find a relationship between different attributes in a dataset.
Statistically, correlation can be quantified by means of a correlation coefficient, typically referred as Pearson’s co-efficient which is always in the range of -1 to +1.
A value of -1 indicates a total negative relationship and +1 indicates a total positive relationship.
Any number closer to zero represents very low or no relationship at all. There is a statistical calculation involved to find this co-efficient and using this you can identify the correlation between two attributes with numerical data.
It can be a very statistically intensive process if the task is to identify correlation between many numeric variables.
Correlation plots can be used to quickly calculate the correlation coefficients without dealing with a lot of statistics, effectively helping to identify correlations in a dataset.
Step-by-Step Instruction
Step-1: Install the R Package for Correlation Plot
Power BI provides correlation plot visualization in the Power BI Visuals Gallery to create Correlation Plots for correlation analysis.
In this tip we will create a correlation plot in Power BI Desktop using a sample dataset of car performance. It is assumed that Power BI Desktop is already installed on your development machine. So please follow the steps as mentioned below.
This visualization makes using of the R “corrplot” package. The same plot can be generated using the R Script visualization and some code. Instead this visualization eliminates the need for coding and provides parameters to configure the visualization.
The first step is to download the correlation plot
Install the R correlation package.
From the File à Import à custom visual from marketplace
Step-2: Expand the correlation plot to the entire area
After the correlation plot is added to the report layout, enlarge it to occupy the entire available area on the report. After you have done this, the interface should look as shown below.
Step 3: Download the CSV file (cars.csv)
Now that you have the visualization, it is time to populate it with some data on which correlation analysis can be performed.
You need a dataset with many numerical attributes.
The file contains data on car performance with metrics like
miles per gallon,
horsepower,
transmission,
acceleration,
cylinder,
displacement,
weight,
gears, etc.
Click on the Get Data menu and select CSV since we have the data in a csv file format.
Step-4: Edit the file and select “Use First Row as Header”
This will open a dialog box to select the file.
Navigate to the downloaded file and select it.
This will read a few records from the file and show a data preview as shown below.
The column headers are in the first row.
Click on the edit button to indicate this before importing the dataset.
Click on the “Use First Row as Headers” to get the column names properly.
You can also rename the Car Names column and name it Model.
Step-5: Apply the changes
After you apply the setting, the column names should look as shown below.
Click on the Close and Apply button to complete the import process.
Step-6: Import the data into the Power BI Desktop
The model should look as shown below.
Select the fields and add them to the visualization.
Click on the visualization in the report layout and add all the fields from the model except the model field which is a categorical / textual field.
The visualization would look as shown below.
Step-7: Points for consideration when reading the plot
The dark blue circles in a diagonal line from top left to bottom right shows correlation of an attribute with itself, which is always the strongest or 1. So this should not be read as correlation, but just as a separator line.
The more the circle has a dark blue color, it signifies stronger positive correlation. The darker the red color, it signifies a negative correlation. Lighter or white colors signifies weak or no correlation.
The scale can be used to estimate the correlation coefficient value.
Step-8: A Few Modifications in the Plot to Make it Visually Analyzable
Make a few modifications in this plot to make it visually analyzable.
Click on the Format option, in the Labels section and increase the font size, so that the field labels are clearly visible as shown below.
As you can see, weight (wt) has a strong positive correlation with displacement (disp) and miles per gallon (mpg) has a strong negative correlation with weight (wt).
The data is shown in a matrix format and there are many positive and negative correlation spreads in the plot.
Step-9: Draw a Cluster
It would be easier to analyze correlation if attributes with the same type of correlation are clustered together.
To do so, select the correlation plot parameters and set the “Draw clusters” property to “Auto”. This will cluster and reorganize the attributes as shown below.
Step-10: Add Number for Easy Analysis
The strength of the correlation is still shown by the depth of the color.
It would be easier to analyze the data if it is shown by a number indicating this strength – i.e. correlation coefficient.
To do so, switch On the Correlation Coefficients section and increase the font size, so that you can see the coefficient clearly.
Using the values as a reference, you can easily find out the strongest and weakest correlation in the entire dataset.
There are other sections for formatting the data, but those are mostly related to cosmetic aspects of the plot like title, background, transparency, title, etc.
You can try to modify those settings and make the plot more suitable to the theme of the report.
You can add Title from the Format section.
With Power BI, without digging into any coding or complex statistical calculations, one can derive correlation analysis from the data by using the correlation plot in Power BI Desktop.
The purpose of this discussion is to address one of the sectors that utilizes a few unique information technology (IT) requirements. The selected sector for this discussion is health care. The discussion addresses the IT needs based on a case study. The discussion begins with Information Technology Key Role in Business, followed by the Healthcare Industry Case Study.
Information Technology Key Role in
Business
Information technology (IT) is a critical
resource for businesses in the age of Big Data and Big Data Analytics (Dewett & Jones, 2001; Pearlson & Saunders,
2001). IT supports and consumes a significant amount
of the resources of enterprises. IT
needs to be managed wisely like other significant
types of business resources such as people, money, and machines. These resources
must return a value to the business. Thus, enterprises must carefully evaluate
its resources including the IT resources that can be efficiently and effectively used.
Information system and technology are now integrated with almost every aspect of
every business. IT and IS play significant roles in business, as it simplifies the
organizational activities and processes.
Enterprises can gain competitive advantages when utilizing appropriate information technology. The inadequate
information system can cause a breakdown in providing services to customers or
developing products which can harm sales and eventually the businesses (Bhatt & Grover, 2005; Brynjolfsson & Hitt,
2000; Pearlson & Saunders, 2001). The same thing applies when inefficient
business processes sustained by ill-fitting information system and technology
as they increase the cost on the business without any return on investment or
value. The lag in the implementation or
poor process adaptation reduce the profits and the growth and can place the
business behind other competitors. The failure of the information system and technology in business is caused primarily
by ignoring them during the planning of the business strategy and
organizational strategy. IT will fail to
support business goals and organizational systems because it was not considered in the business and
organizational strategy. When the business
strategy is misaligned with the
organizational strategy, IT is subject to failure (Pearlson & Saunders, 2001).
IT
Support to Business Goals
Enterprises should invest in IT resources that will benefit them. They should
make investment in systems that
supports their business goals including gaining competitive advantages (Bhatt & Grover, 2005).
Although IT represents a significant
investment in businesses, yet, the poorly
chosen information system can become an obstacle to achieving the business
goals (Dewett & Jones, 2001; Henderson &
Venkatraman, 1999; Pearlson & Saunders, 2001). When the IT does not allow the business to
achieve its goals, or lack the capacity required to collect, store, and
transfer critical information for the business, the results can be disastrous,
leading to dissatisfied customers, or excessive costs for production. The Toys R US store is an excellent example of such an issue (Pearlson & Saunders, 2001).
The well-publicized website was not designed to process and fulfill
orders fast enough. The site could be redesigned with an additional cost which could have been
saved if the IT strategy and business goals were discussed together to
be aligned together.
IT
Support to Organizational Systems
Organizations systems including people,
work processes, and structure represent the core elements of the business. Enterprises should plan to enable these
systems to work together efficiently to achieve the business goals (Henderson & Venkatraman, 1999; Pearlson &
Saunders, 2001; Ryssel, Ritter, & Georg Gemünden, 2004).
When the IT of the business fails to
support the business’ organization systems, the result is a misalignment of the
resources needed to achieve the business goals.
For instance, when organizations decide to use Enterprise Resource
Planning (ERP) system, the system often dictates how many business processes are executed.
When enterprises deploy a technology, they should think through various
aspects such as how the technology will be used
in the organization, who will use it, how they will use it, how to make sure
the application chosen accomplishes what is intended. For instance, an organization which plans to
institute a wide-scale telecommuting program
would need an information system strategy that is compatible with its
organization strategy (Pearlson & Saunders, 2001).
The desktop PCs located within the corporate office are not the right
solution for a telecommuting organization.
Laptop computers application that are
accessible online anywhere and anytime are a most
appropriate solution. If a business only allows the purchase of desktop
PCs and only builds systems accessible from desks within the office, the
telecommuting program is subject to failure. Thus, information systems implementation
should support the organizational systems and should be aligned with the business goals.
Advantages
of IT in Business
Business is able to transform local
business to international business with the advent of information system and
internet (Bhatt & Grover, 2005; Zimmer, 2018).
Organizations are under pressures to take advantages of information
technology to gain competitive advantages.
They are turning to information technology to streamline services and
enhance the performance. IT has become
an essential feature in the landscape of the business that aid business to
decrease the costs, improve communication, develop recognition, and release
more innovative and attractive products.
IT streamlines communication as effective communication is critical to an organization’s success (Bhatt & Grover, 2005; Zimmer, 2018). A key advantage of information system
lies in its ability to streamline communication both internally and
externally. For instance, online meeting
and video conferencing platform such as Skype, WebEx provide business the
opportunity to collaborate virtually in real-time, reducing costs associated
with bringing clients on-site or communicating with staff who work
remotely. IT enables Enterprises to
connect almost effortlessly with international suppliers and consumers.
IT can enhance the competitive advantages
in the marketplace of the business by facilitating strategic thinking and
knowledge transfer (Bhatt & Grover, 2005; Zimmer, 2018).
When using IT as a strategic investment and not as a means to an end, IT
provides business with the tools they need to properly evaluate the market and
implement strategies needed for a competitive edge.
IT stores and safeguards information, as information management is another domain
of IT (Bhatt & Grover, 2005; Zimmer, 2018).
IT is essential to any business that must store and safeguard sensitive
information such as financial data for long periods. Various security techniques can be applied to
ensure the data is stored in a secure
place. Organizations should evaluate the
options available to store their data such as locally using local data center
or cloud-based storage methods.
IT cuts costs and eliminate waste (Bhatt & Grover, 2005; Zimmer, 2018). Although
IT implementation at the beginning will be expensive, in the long run, it
becomes incredibly cost-effective by streamlining the operational and
managerial processes of the business.
Thus, investing in the appropriate
IT is key for a business to gain a return on
investment. For instance, the
implementation of online training programs is a classic example of IT improving
the internal processes of the business by reducing the costs and employees’
time spent outside of work, and travel
costs. Information technology enables
organizations to implement more with less investment without sacrificing
quality or value.
Healthcare Industry Case Study
The healthcare
industry generated extensive data driven
by keeping patients’ records, complying with regulations and policies, and
patients care (Raghupathi & Raghupathi, 2014). The current trend is digitalizing this
explosive growth of the data in the age of Big Data (BD) and Big Data Analytics
(BDA) (Raghupathi & Raghupathi, 2014). BDA has made a revolution in healthcare by
transforming the valuable information, knowledge to predict epidemics, cure
diseases, improve quality of life, and avoid preventable deaths (Van-Dai, Chuan-Ming, & Nkabinde, 2016). Various applications of BDA in healthcare
include pervasive health, fraud detection, pharmaceutical discoveries, clinical
decision support system, computer-aided diagnosis, and biomedical
applications.
Healthcare
sector employs BDA in various aspect of healthcare such as detecting diseases
at early stages, providing evidence-based medicine, minimizing doses of
medication to avoid any side effects, and delivering useful medicine base on genetic analysis. The use of BD and BDA can reduce the
re-admission rate, and thereby the healthcare related costs for patients are reduced.
Healthcare BDA can be used to detect spreading diseases earlier before
the disease gets spread using real-time analytics (Archenaa & Anita, 2015; Raghupathi &
Raghupathi, 2014; Wang, Kung, & Byrd, 2018). Example of the application of BDA in the healthcare system is Kaiser Permanente
implementing a HealthConnect technique to ensure data exchange across all
medical facilities and promote the use of electronic health records (Fox & Vaidyanathan, 2016).
Despite the various
benefits of BD and BDA in the healthcare
sector, various challenges and issues are emerging from the application of BDA
in healthcare. The nature of the
healthcare industry poses challenging to
BDA (Groves, Kayyali, Knott, & Kuiken, 2016). The episodic culture, the data puddles, and
the IT leadership are the three significant
challenges of the healthcare industry to apply BDA. The episodic culture addresses the
conservative culture of the healthcare and the lack of IT technologies mindset
creating rigid culture. Few providers
have overcome this rigid culture and started to use the BDA technology. The
data puddles reflect the silo nature of healthcare. Silo is
described as one of the most significant
flaws in the healthcare sector (Wicklund, 2014). The use of the technology properly is lacking
in healthcare sector resulting in making the industry fall behind other
industries. All silos use their methods to collect data from labs, diagnosis,
radiology, emergency, case management and so forth. The IT leadership is another challenge is caused by the rigid culture of the
healthcare industry. The lack of the
latest technologies among the IT leadership in the healthcare industry is a severe problem.
The
current healthcare data is collected from clinical and non-clinical sources (InformationBuilders, 2018; Van-Dai et al., 2016; Zia & Khan, 2017). The electronic healthcare records are digital
copies of the medical history of the patients.
It contains a variety of data relevant to the care of the patients such
as demographics, medical problems, medications, body mass index, medical
history, laboratory test data, radiology reports, clinical notes, and payment
information. These electronic healthcare records are the most critical data in healthcare data analytics,
because it provides effective and efficient methods for the providers and
organizations to share data (Botta, de Donato, Persico, & Pescapé, 2016; Palanisamy &
Thirunavukarasu, 2017; Van-Dai et al., 2016; Wang et al., 2018).
The biomedical
imaging data plays a crucial role in
healthcare data to aid disease monitoring, treatment planning and
prognosis. This data can be used to
generate quantitative information and make inferences from the images that can
provide insights into a medical condition.
The images analytics is more complicated
due to the noises of the data associated with the images and is one of the significant limitations with biomedical
analysis (Ji, Ganchev, O’Droma, Zhang, & Zhang, 2014; Malik & Sangwan,
2015; Van-Dai et al., 2016).
The sensing data is ubiquitous in the medical domain both for real-time and for historical data analysis. The sensing data involve several forms of medical data collection instruments such as the electrocardiogram (ECG) and electroencephalogram (EEG) which are vital sensors to collect signals from various parts of the human body. The sensing data plays a significant role for intensive care units (ICU) and real-time remote monitoring of patients with specific conditions such as diabetes or high blood pressure. The real-time and long-term analysis of various trends and treatment in remote monitoring programs can help providers monitor the state of those patients with certain conditions(Van-Dai et al., 2016).
The biomedical signals are collected from many sources such as hearts,
blood pressure, oxygen saturation levels, blood glucose, nerve conduction, and brain activity. Examples of biomedical signals include
electroneurogram (ENG), electromyogram (EMG), electrocardiogram (ECG),
electroencephalogram (EEG), electrogastrogram (EGG), and phonocardiogram
(PCG). The biomedical signals real-time
analytics will provide better management of chronic diseases, earlier detection
of adverse events such as heart attacks, and strokes and earlier diagnosis of
disease. These biomedical signals can
be discrete or continuous based on the kind of care or severity of a particular
pathological condition (Malik &
Sangwan, 2015; Van-Dai et al., 2016).
The genomic data
analysis helps better understand the
relationship between various genetic, mutations, and disease conditions. It has
great potentials in the development of various gene therapies to cure certain
conditions. Furthermore, the genomic
data analytics can assist in translating genetic discoveries into personalized
medicine practice (Liang & Kelemen, 2016; Luo, Wu, Gopukumar, & Zhao, 2016;
Palanisamy & Thirunavukarasu, 2017; Van-Dai et al., 2016).
The clinical
text data analytics using the data mining are the transformation process of the
information from clinical notes stored in unstructured data format to useful patterns. The manual coding of clinical notes is costly
and time-consuming, because of their
unstructured nature, heterogeneity, different
format, and context across different patients and practitioners. Various methods such as natural language
processing (NLP) and information retrieval can be used to extract useful
knowledge from large volume of clinical text and automatically encoding
clinical information in a timely manner (Ghani, Zheng, Wei, & Friedman, 2014; Sun & Reddy, 2013; Van-Dai
et al., 2016).
The social
network healthcare data analytics is based
on various kinds of collected social media sources such as social networking
sites, e.g., Facebook, Twitter, Web Logs,
to discover new patterns and knowledge that can be leveraged to model and
predict global health trends such as outbreaks of infections epidemics (InformationBuilders, 2018; Luo et al., 2016; Van-Dai et al., 2016; Zia
& Khan, 2017).
IT
Requirements for Healthcare Sector
The basic
requirement for the implementation of this proposal included not only the tools and required software, but also the
training at all levels from staff, to nurses, to clinicians, to patients. The list of the requirements is divided into system requirement,
implementation requirement, and training
requirements.
Cloud Computing
Technology Adoption Requirement
The volume is
one of the significant characteristics of
BD, especially in the healthcare industry
(Manyika et al., 2011). Based on the challenges addressed earlier
when dealing with BD and BDA in healthcare, the system requirements cannot be
met using the traditional on-premise technology center, as it cannot handle the
intensive computation requirements of BD, and the storage requirement for all
the medical information from various hospitals from the four States (Hu, Wen, Chua, & Li, 2014). Thus, the cloud computing
environment is found to be more appropriate and a solution for the implantation
of this proposal. Cloud computing plays
a significant role in BDA (Assunção, Calheiros, Bianchi, Netto, & Buyya, 2015). The massive computation and storage
requirement of BDA brings the critical need for cloud computing emerging
technology (Mehmood, Natgunanathan, Xiang, Hua, & Guo, 2016). Cloud computing offers various benefits such
as cost reduction, elasticity, pay per use, availability, reliability, and maintainability (Gupta, Gupta, & Mohania, 2012; Kritikos, Kirkham, Kryza, &
Massonet, 2017). However, although cloud computing offers
various benefits, it has security and privacy issues using the standard
deployment models of public cloud, private cloud, hybrid cloud, and community
cloud. Thus, one of the major
requirements is to adopt the Virtual Private Cloud as it has been regarded as the most prominent approach to
trusted computing technology (Abdul, Jena, Prasad, & Balraju, 2014).
Cloud computing
has been facing various threats (Cloud Security Alliance, 2013, 2016, 2017). Records showed that over the last three
years from 2015 until 2017, the number of breaches, lost medical records, and settlements of fines are staggering (Thompson, 2017). The
Office of Civil Rights (OCR) issued 22 resolution agreements, requiring
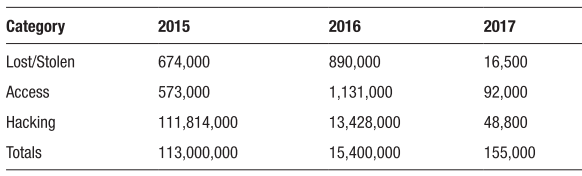
monetary settlements approaching $36 million (Thompson, 2017). Table 1
shows the data categories and the total for each year.
Table 1. Approximation of Records Lost by Category Disclosed on HHS.gov (Thompson, 2017)
Furthermore, a
recent report published by HIPAA showed the first three months of 2018 experienced
77 healthcare data breaches reported to the OCR (HIPAA, 2018d). In the second quarter of 2018, at least 3.14
million healthcare records were exposed (HIPAA, 2018a). In the third quarter of 2018, 4.39 million
records exposed in 117 breaches (HIPAA, 2018c).
Thus, the
protection of the patients’ private information requires the technology to
extract, analyze, and correlated potentially sensitive dataset (HIPAA, 2018b). The implementation of BDA requires security
measures and safeguards to protect the privacy of the patients in the
healthcare industry (HIPAA, 2018b). Sensitive data should be encrypted to prevent
the exposure of data in the event of theft (Abernathy & McMillan, 2016). The security requirements involve security at
the VPC cloud deployment model as well as at the local hospitals in each State (Regola & Chawla, 2013). The security at the VPC cloud deployment
model should involve the implementation of security groups and network access
control lists to allow access to the right individuals to the right
applications and patients’ records.
Security group in VPC acts as the first
line of defense firewall for the associated instances of the VPC (McKelvey, Curran, Gordon, Devlin, & Johnston, 2015). The network access control lists act as the second
layer of defense firewall for the associated subnets, controlling the inbound
and the outbound traffic at the subnet level (McKelvey et al., 2015).
The security at
the local hospitals level in each State is mandatory to protect patients’
records and comply with HIPAA regulations (Regola & Chawla, 2013). The medical equipment must be secured with
authentication and authorization techniques so that only the medical staff,
nurses and clinicians have access to the medical devices based on their
role. The general access should be prohibited as every member of the hospital has a different role with
different responses. The encryption should be used to hide the
meaning or intent of communication from unintended users (Stewart, Chapple, & Gibson, 2015). The encryption is an essential element in
security control especially for the data in transit (Stewart et al., 2015). The hospital in all four State should
implement the encryption security control
using the same type of the encryption across the hospitals such as PKI, cryptographic application, and cryptography and
symmetric key algorithm (Stewart et al., 2015).
The system
requirements should also include the identity management systems that can
correspond with the hospitals in each state. The identity management system
provides authentication and authorization
techniques allowing only those who should have access to the patients’ medical
records. The proposal requires the
implementation of various encryption techniques such as secure socket layer
(SSL), Transport Layer Security (TLS), and Internet Protocol Security (IPSec)
to protect information transferred in public network (Zhang & Liu, 2010).
Hadoop Implementation
for Data Stream Processing Requirement
While the
velocity of BD leads to the speed of generating large volume of data and
requires speed in data processing (Hu et al., 2014), the variety of the data requires specific technology capabilities to handle
various types of dataset such as structured, semi-structured, and unstructured
data (Bansal, Deshpande, Ghare, Dhikale, & Bodkhe, 2014; Hu et al., 2014). Hadoop ecosystem is found to be the most
appropriate system that is required to implement BDA (Bansal et al., 2014; Dhotre, Shimpi, Suryawanshi, & Sanghati, 2015). The implementation requirements include
various technologies and various tools.
This section covers various components that are required when implementing
Hadoop technology in the four States for healthcare BDA system.
Hadoop has
three significant limitations, which must
be addressed in this design. The first limitation is the lack of technical
support and document for open source Hadoop (Guo,
2013). Thus, this design requires the Enterprise
Edition of Hadoop to get around this limitation using Cloudera, Hortonworks, and MapR (Guo,
2013).
The final decision for which product will be
determined by the cost analysis team.
The second limitation is that Hadoop is not optimal for real-time data
processing (Guo,
2013).
The solution for this limitation will require the integration of real-time
streaming program as Spark or Storm or Kafka (Guo,
2013; Palanisamy & Thirunavukarasu, 2017). This requirement of
integrating Spark is discussed below in a separate requirement for this design (Guo,
2013).
The third limitation is that Hadoop is not a good
fit for large graph dataset (Guo,
2013).
The solution for this limitation requires the integration of GraphLab which is
also discussed below in a separate requirement for this design.
Conclusion
Information
technology (IT) play a significant role
in various industries including the healthcare
sector. This project discussed the IT
role in businesses, the requirement to be aligned with the strategic goal and
organizational system of the business.
If IT systems are not included
during the planning of the business strategy and organizational strategy, the
IT integration into the business at a later
stage is very likely to set for failure.
IT offers various advantages to business including the competitive
advantages in the marketplace.
Healthcare industry is no exception to integrate IT systems. Healthcare sector has been suffering from
various challenges including the high cost of services and inefficient service
to patients. The case study showed the
need for IT systems requirements that can place the industry into competitive
advantages offering better care to patients with low cost. Various IT integrations have been used lately in the healthcare
industry including Big Data Analytics, Hadoop technology, security systems, and
cloud computing. Kaiser Permanente, for instance, applied Big Data Analytics
using HealthConnet to provide care to
patients with lower cost and better care, which are
aligned with the strategic goal of
its business.
References
Abdul, A. M., Jena, S., Prasad, S.
D., & Balraju, M. (2014). Trusted Environment In Virtual Cloud. International Journal of Advanced Research
in Computer Science, 5(4).
Abernathy, R.,
& McMillan, T. (2016). CISSP Cert
Guide: Pearson IT Certification.
Archenaa, J.,
& Anita, E. M. (2015). A survey of big data analytics in healthcare and
government. Procedia Computer Science, 50,
408-413.
Assunção, M. D.,
Calheiros, R. N., Bianchi, S., Netto, M. A. S., & Buyya, R. (2015). Big
Data Computing and Clouds: Trends and Future Directions. Journal of Parallel and Distributed Computing, 79, 3-15.
doi:10.1016/j.jpdc.2014.08.003
Bansal, A.,
Deshpande, A., Ghare, P., Dhikale, S., & Bodkhe, B. (2014). Healthcare data
analysis using dynamic slot allocation in Hadoop. International Journal of Recent Technology and Engineering, 3(5),
15-18.
Bhatt, G. D.,
& Grover, V. (2005). Types of information technology capabilities and their
role in competitive advantage: An empirical study. Journal of management information systems, 22(2), 253-277.
Botta, A., de
Donato, W., Persico, V., & Pescapé, A. (2016). Integration of Cloud
Computing and Internet Of Things: a Survey. Future
Generation computer systems, 56, 684-700.
Brynjolfsson, E.,
& Hitt, L. M. (2000). Beyond computation: Information technology,
organizational transformation and business performance. Journal of Economic perspectives, 14(4), 23-48.
Cloud Security
Alliance. (2013). The Notorious Nine: Cloud Computing Top Threats in 2013. Cloud Security Alliance: Top Threats Working
Group.
Cloud Security
Alliance. (2016). The Treacherous 12: Cloud Computing Top Threats in 2016. Cloud Security Alliance: Top Threats Working
Group.
Cloud Security
Alliance. (2017). The Treacherous 12 Top Threats to Cloud Computing. Cloud Security Alliance: Top Threats Working
Group.
Dewett, T., &
Jones, G. R. (2001). The role of information technology in the organization: a
review, model, and assessment. Journal of
Management, 27(3), 313-346.
Dhotre, P.,
Shimpi, S., Suryawanshi, P., & Sanghati, M. (2015). Health Care Analysis
Using Hadoop. Internationaljournalofscientific&tech
nologyresearch, 4(12), 279r281.
Fox, M., &
Vaidyanathan, G. (2016). Impacts of Healthcare Big Data: A Framwork With Legal and Ethical Insights. Issues in Information Systems, 17(3).
Ghani, K. R.,
Zheng, K., Wei, J. T., & Friedman, C. P. (2014). Harnessing big data for
health care and research: are urologists ready? European urology, 66(6), 975-977.
Groves, P.,
Kayyali, B., Knott, D., & Kuiken, S. V. (2016). The ‘Big Data’ Revolution
in Healthcare: Accelerating Value and Innovation.
Guo, S. (2013). Hadoop operations and cluster management
cookbook: Packt Publishing Ltd.
Gupta, R., Gupta,
H., & Mohania, M. (2012). Cloud
Computing and Big Data Analytics: What is New From Databases Perspective?
Paper presented at the International Conference on Big Data Analytics,
Springer-Verlag Berlin Heidelberg.
Henderson, J. C.,
& Venkatraman, H. (1999). Strategic alignment: Leveraging information
technology for transforming organizations. IBM
systems journal, 38(2.3), 472-484.
Hu, H., Wen, Y.,
Chua, T., & Li, X. (2014). Toward Scalable Systems for Big Data Analytics:
A Technology Tutorial. Practical
Innovation, Open Solution, 2, 652-687. doi:10.1109/ACCESS.2014.2332453
Ji, Z., Ganchev,
I., O’Droma, M., Zhang, X., & Zhang, X. (2014). A cloud-based X73
ubiquitous mobile healthcare system: design and implementation. The Scientific World Journal, 2014.
Kritikos, K.,
Kirkham, T., Kryza, B., & Massonet, P. (2017). Towards a Security-Enhanced
PaaS Platform for Multi-Cloud Applications. Future
Generation computer systems, 67, 206-226. doi:10.1016/j.future.2016.10.008
Liang, Y., &
Kelemen, A. (2016). Big Data Science and its Applications in Health and Medical
Research: Challenges and Opportunities. Austin
Journal of Biometrics & Biostatistics, 7(3).
Luo, J., Wu, M.,
Gopukumar, D., & Zhao, Y. (2016). Big data application in biomedical
research and health care: a literature review. Biomedical informatics insights, 8, BII. S31559.
Malik, L., &
Sangwan, S. (2015). MapReduce Framework Implementation on the Prescriptive
Analytics of Health Industry. International
Journal of Computer Science and Mobile Computing, ISSN, 675-688.
Manyika, J.,
Chui, M., Brown, B., Bughin, J., Dobbs, R., Roxburgh, C., & Byers, A. H.
(2011). Big Data: The Next Frontier for Innovation, Competition, and
Productivity. McKinsey Global Institute.
McKelvey, N.,
Curran, K., Gordon, B., Devlin, E., & Johnston, K. (2015). Cloud Computing
and Security in the Future Guide to
Security Assurance for Cloud Computing (pp. 95-108): Springer.
Mehmood, A.,
Natgunanathan, I., Xiang, Y., Hua, G., & Guo, S. (2016). Protection of Big
Data Privacy. Institute of Electrical and
Electronic Engineers, 4, 1821-1834. doi:10.1109/ACCESS.2016.2558446
Palanisamy, V.,
& Thirunavukarasu, R. (2017). Implications of Big Data Analytics in
developing Healthcare Frameworks–A review. Journal
of King Saud University-Computer and Information Sciences.
Pearlson, K.,
& Saunders, C. (2001). Managing and Using Information Systems: A Strategic
Approach. 2001: USA: John Wiley & Sons.
Raghupathi, W.,
& Raghupathi, V. (2014). Big data analytics in healthcare: promise and
potential. Health Information Science and
Systems, 2(1), 1.
Regola, N., &
Chawla, N. (2013). Storing and Using Health Data in a Virtual Private Cloud. Journal of medical Internet research, 15(3),
1-12. doi:10.2196/jmir.2076
Ryssel, R.,
Ritter, T., & Georg Gemünden, H. (2004). The impact of information
technology deployment on trust, commitment and value creation in business
relationships. Journal of business &
industrial marketing, 19(3), 197-207.
Stewart, J.,
Chapple, M., & Gibson, D. (2015). ISC
Official Study Guide. CISSP Security
Professional Official Study Guide (7th ed.): Wiley.
Thompson, E. C.
(2017). Building a HIPAA-Compliant
Cybersecurity Program, Using NIST 800-30 and CSF to Secure Protected Health
Information.
Van-Dai, T.,
Chuan-Ming, L., & Nkabinde, G. W. (2016, 5-7 July 2016). Big data stream computing in healthcare
real-time analytics. Paper presented at the 2016 IEEE International
Conference on Cloud Computing and Big Data Analysis (ICCCBDA).
Wang, Y., Kung,
L. A., & Byrd, T. A. (2018). Big Data Analytics: Understanding its
Capabilities and Potential Benefits for Healthcare Organizations. Technological Forecasting and Social Change,
126, 3-13. doi:10.1016/j.techfore.2015.12.019
Zhang, R., &
Liu, L. (2010). Security models and
requirements for healthcare application clouds. Paper presented at the
Cloud Computing (CLOUD), 2010 IEEE 3rd International Conference on.
Zia, U. A., &
Khan, N. (2017). An Analysis of Big Data Approaches in Healthcare Sector. International Journal of Technical Research
& Science, 2(4), 254-264.
Zimmer,
T. (2018). What Are the Advantages of Information Technology in Business?
The purpose of this project is to
discuss critical information technology solutions used to gain competitive
advantages. The discussion begins with
Big Data and Big Data Analytics addressing essential topics such as the Hadoop ecosystem, NoSQL databases, Spark
integration for real-time data processing, and Big Data Visualization. Cloud computing is an emerging technology to solve
Big Data challenges such as storage for the large volume of the data, and the
high-speed data processing to extract value from data. Enterprise Resource Planning (ERP) is a
system that can aid organizations to gain competitive advantages if implemented
right. The project discusses various
success factor for the ERP system. Big Data plays a significant role in ERP,
which is also discussed in this
project. The last technology addressed
in this project is the Customer Relationship Management (CRM), its building
blocks and integration. The project
addresses the challenges and costs associated with CRM. The best practice of CRM is addressed which can assist in the successful implementation of CRM. In summary, enterprises should evaluate
various information technology systems that are developed to aid them to gain
competitive advantages.
Keywords: Big
Data Analytics; Cloud Computing; ERP; CRM.
Enterprises
should evaluate various information technologies to gain competitive advantages
in the market. Big Data and Big Data
Analytics are one of the significant topics in information technology
and computer science. Cloud computing is
another critical topic in the same domains, as cloud computing emerged to solve
the challenge of Big Data. Thus, this
project begins with these top information technologies. The discussion covers various major topics in
Big Data such as the Hadoop ecosystem,
Spark for real-time processing. The
discussion of the cloud computing covers the various service models and
deployment models which cloud computing offers.
The most common
business areas that require information technology support include Enterprise
Resource Planning (ERP), Customer Relationship Management (CRM), Product Life
Cycle Management (PLM), Supply Chain Management (SCM), and Supplier
Relationship Management (SRM) (DuttaRoy, 2016). Thus, this project discusses ERP and CRM as
additional critical information technology systems that aid Enterprises gain competitive advantages.
Big Data is
now the buzzword in the field of computer
science and information technology. Big
Data attracted the attention of various sectors, researchers, academia,
government and even the media (Géczy, 2014; Kaisler, Armour, Espinosa, & Money,
2013). In the 2011 report of the International Data
Corporation (IDC), it is reporting that the amount of the information which
will be created and replicated will exceed 1.8 zettabytes which are 1.8 trillion gigabytes in 2011. This amount
of information is growing by a factor of 9 in just five years (Gantz & Reinsel, 2011).
BD and BDA are
terms that have been used interchangeably
and described as the next frontier for innovation, competitions, and productivity (Maltby, 2011; Manyika et al., 2011). BD has a multi-V model with unique
characteristics, such as volume referring to the large dataset, velocity refers to the speed of the computation as well
as data generation, and variety referring to the various data types such as
semi-structured and unstructured (Assunção, Calheiros, Bianchi, Netto, & Buyya, 2015; Hu, Wen, Chua,
& Li, 2014). BD is
described as the next frontier for competition, innovation, and productivity. Various industries have taken this
opportunity and applied BD and BDA in their business models (Manyika et al., 2011). There are many technologies such
as Cloud Computing, Hadoop Map/Reduce
Hive, and others have emerged to deal with the phenomena of the Big Data. Data without analysis has no value to
organizations.
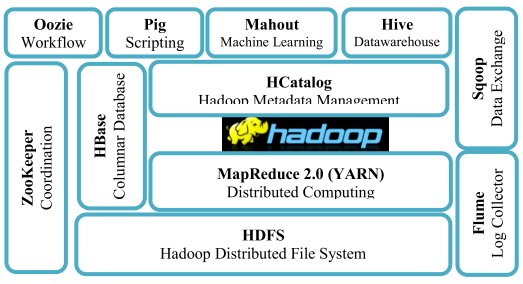
While the velocity of BD leads to the speed of generating large volume of data and requires speed in data processing (Hu et al., 2014), the variety of the data requires specific technology capabilities to handle various types of dataset such as structured, semi-structured, and unstructured data (Bansal, Deshpande, Ghare, Dhikale, & Bodkhe, 2014; Hu et al., 2014). Hadoop ecosystem is found to be the most appropriate system that is required to implement BDA (Bansal et al., 2014; Dhotre, Shimpi, Suryawanshi, & Sanghati, 2015). Hadoop technologies have been in the front-runner for Big Data application (Bansal et al., 2014; Chrimes, Zamani, Moa, & Kuo, 2018). Hadoop ecosystem will be part of the implementation requirement as it is proven to serve well with intensive computation using large datasets (Raghupathi & Raghupathi, 2014; Wang, Kung, & Byrd, 2018). The Hadoop version that is required is version 2.x to include YARN for resource management (Karanth, 2014). Hadoop 2.x also include HDFS snapshots to provide a read-only image of the entire or a particular subset of a filesystem to protect against user errors, backup, and disaster recovery (Karanth, 2014). The Hadoop platform can be implemented to gain more insight into various areas (Raghupathi & Raghupathi, 2014; Wang et al., 2018). Hadoop ecosystem involves Hadoop Distributed File System, MapReduce, and NoSQL database such as HBase, and Hive to handle a large volume of dataset using various algorithms and machine learning to extract values from the medical records that are structured, semi-structured, and unstructured (Raghupathi & Raghupathi, 2014; Wang et al., 2018). Other components to support Hadoop ecosystem include Oozie for workflow, Pig for scripting, and Mahout for machine learning which is part of the artificial intelligence (AI) (Ankam, 2016; Karanth, 2014). Hadoop ecosystem includes other tools such as Flume for log collector, Sqoop for data exchange, and Zookeeper for coordination (Ankam, 2016; Karanth, 2014). HCatalog is a required component to manage the metadata in Hadoop (Ankam, 2016; Karanth, 2014). Figure 1 shows the Hadoop ecosystem before integrating Spark for real-time analytics.
In the age of BD
and BDA, the traditional data store is found inadequate to handle not only the
large volume of the dataset but also the various types of the data format such
as unstructured and semi-structured (Hu et al., 2014). Thus,
Not Only SQL (NoSQL) database is emerged to meet the requirement of the
BDA. These NoSQL data stores are used for modern, and scalable databases (Sahafizadeh & Nematbakhsh, 2015). The scalability feature of the NoSQL data
stores enables the systems to increase the throughput when the demand increases
during the processing of the data (Sahafizadeh & Nematbakhsh, 2015). The platform can incorporate two scalability
types to support the large volume of the datasets; the horizontal and vertical scalability. The horizontal scaling allows the
distribution of the workload across many servers and nodes to increase the
throughput, while the vertical scaling requires more processors, more memories
and faster hardware to be installed on a
single server (Sahafizadeh & Nematbakhsh, 2015).
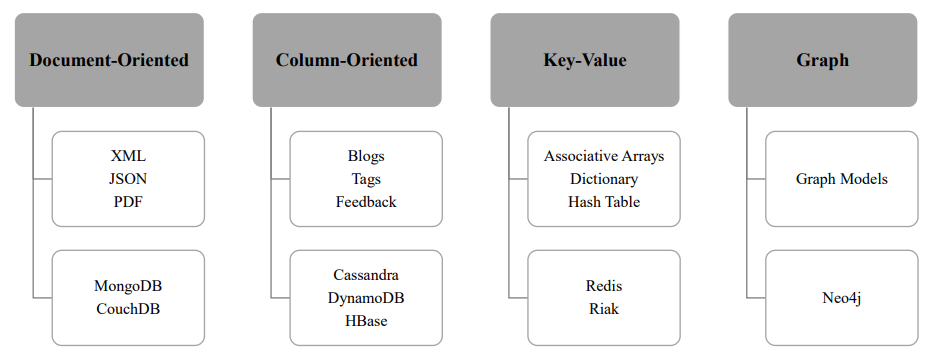
NoSQL data stores have various types such as MongoDB, CouchDB, Redis, Voldemort, Cassandra, Big Table, Riak, HBase, Hypertable, ZooKeeper, Vertica, Neo4j, db4o, and DynamoDB. These data stores are categorized into four types: document-oriented, column-oriented or column-family stores, graph database, and key-value (EMC, 2015; Hashem et al., 2015). The document-oriented data store can store and retrieve collections of data and documents using complex data forms in various formats such as XML and JSON as well as PDF and MS word (EMC, 2015; Hashem et al., 2015). MongoDB and CouchDB are examples of document-oriented data stores (EMC, 2015; Hashem et al., 2015). The column-oriented data store can store the content in columns aside from rows with the attributes of the columns stored contiguously (Hashem et al., 2015). This type of datastore can store and render blog entries, tags, and feedback (Hashem et al., 2015). Cassandra, DynamoDB, and HBase are examples of column-oriented data stores (EMC, 2015; Hashem et al., 2015). The key-value can store and scale large volumes of data and contains value and a key to access the value (EMC, 2015; Hashem et al., 2015). The value can be complicated, but this type of data stores can be useful in storing the user’s login ID as the key referencing the value of patients. Redis and Riak are examples of the key-value NoSQL data store (Alexandru, Alexandru, Coardos, & Tudora, 2016). Each of these NoSQL data stores has its limitations and advantages. The graph NoSQL database can store and represent data using graph models with nodes, edges, and properties related to one another through relations which will be useful for unstructured medical data such as images, and lab results. Neo4j is an example of this type of graph NoSQL database (Hashem et al., 2015). Figure 2 summarizes these NoSQL data stores, data types for storage, and examples.
Figure 2. Big Data Analytics NoSQL
Data Store Types.
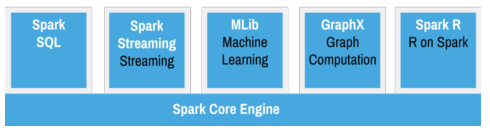
While the architecture of Hadoop ecosystem has been designed in various scenarios for data storage, data management statistical analysis, and statistical association between various data sources distributed computing and batch processing, businesses requires real-time data processing to gain competitive advantages. However, the real-time data processes cannot be met by Hadoop alone (Basu, 2014). Real-time analytics will tremendous value to the healthcare proposed system. Thus, Apache Spark is another component which is required for real-time data processing. Spark allows in-memory processing for fast response time, bypassing MapReduce operations (Basu, 2014). With Spark integration with Hadoop, stream processing, machine learning, interactive analytics, and data integration will be possible (Scott, 2015). Spark will run on top of Hadoop to benefit from YARN and the underlying storage of HDFS, HBase and other Hadoop ecosystem building blocks (Scott, 2015). Figure 3 shows the core engines of the Spark.
Visualization is
one of the most powerful presentations of
the data (Jayasingh, Patra, & Mahesh, 2016). It helps in viewing the data in a more
meaningful way in the form of graphs, images, pie charts that can be understood
easily. It helps in synthesizing a large
volume of data set such as healthcare data to get at the core of such raw big data and convey the key points
from the data for insight (Meyer, M., 2018). Some of
the commercial visualization tools include Tableau, Spotfire, QlikView, and
Adobe Illustrator. However, the most
commonly used visualization tools in healthcare include Tableau, PowerBI, and
QlikView.
Numerous studies
discussed and addressed the definition of cloud computing, as it was not well
defined (Foster, Zhao, Raicu, & Lu, 2008). As an effort
to identify precisely the term cloud computing IT practitioners, the
academics and research community came up with various definitions. (Vaquero, Rodero-Merino, Caceres, & Lindner, 2008) suggested twenty-two
definitions to cloud computing from different research studies. The underlying concepts of cloud computing
rely heavily on providing computing
power, storage services, software services, and platform services on demand to
customers over the internet (Lewis, 2010). The access to cloud computing services can
scale up or down as needed, and the
consumers use the pay-per-use or
pay-as-you-go model (Armbrust et al., 2009; Lewis, 2010).
The
National Institute of Standards and Technology (NIST)
proposed an official definition of cloud
computing. Cloud computing enables ubiquitous, convenient, on-demand
network access to a shared pool of configurable computing resources such as
network, servers, storage, applications, and services. Organizations can quickly provision and release these resources with
minimal effort of management or interaction from a service provider (Mell & Grance, 2011).
The
essential characteristics of cloud computing technology identified by NIST include
on-demand self-service, broad network access, resource pooling, rapid
elasticity, and measured service (Mell & Grance, 2011). The on-demand self-service feature provides cloud consumers
the computing capabilities such as server time and network storage as needed
automatically eliminating the need for any human interaction with a service
provider. The broad network access
feature provides capabilities to cloud consumers over the network and the use
of various devices such as mobile phones, and tablets from anywhere enabling
the heterogeneous client platforms. The resource pooling feature provides a
multi-tenant model that serve multiple consumers sharing the pool of
resources. This feature provides location independence, where the consumers do not know the exact location of the provided
resources. The consumer may be able to
specify the location at a higher level of abstraction such as country, state,
or datacenter (Mell & Grance, 2011). The rapid elasticity feature provides
capabilities to scale horizontally and vertically to meet the demand. The measured services feature enables the measurement of the consumption of resources
such as processing, storage, and bandwidth. The resource utilization can be
monitored, controlled, and reported, providing transparency for both the
provider and consumer of the utilized services (Mell & Grance, 2011).
Cloud
computing offers three essential service models as Infrastructure-as-a-Service
(IaaS), Platform-as-a-Service (PaaS), and Software-as-a-Service (SaaS) (Mell & Grance, 2011). The IaaS layer provides the capability to the consumers to
provision storage, processing, networks, and other fundamental computing
resources. Using IaaS, the consumer can deploy and run arbitrary software,
which can include operating systems and application. When using IaaS, the users do not manage or control the underlying infrastructure of the
cloud. The consumers have control over
the storage, the operating systems, and the deployed application and limited
control of some networking components such as host firewall. The PaaS allows the cloud computing consumers
to deploy applications that are created using programming languages, libraries,
services, and tools supported by the providers.
Using PaaS, the cloud computing consumers
do not manage or control the underlying infrastructure of the cloud
including network, servers, operating systems, or storage. The consumers have control over the deployed
applications and possibly configuration settings for the application-hosting
environment. The SaaS allows cloud
computing consumers to use the provider’s applications running on the
infrastructure of the cloud. The SaaS service model consumers can access the
applications from various client devices through either a thin client interface,
such as a web-based email from a web browser, or a program interface. The SaaS consumers do not control or manage the underlying infrastructure of the cloud such as network,
operating systems, storage, or even individual application capabilities, with the
possible exception of limited user-specific application configuration settings (Mell & Grance, 2011).
Cloud computing offers four essential deployment models known as public cloud, private cloud, community cloud, and hybrid cloud (Mell & Grance, 2011). The public cloud reflects the infrastructure of the cloud available to the general public. It can be managed, owned and operated by organizations, academic entities, government entities, or a combination of them. This deployment model resides on the premises of the cloud provider. The private cloud is the cloud infrastructure designed exclusively for a single organization. This deployment model can be managed, owned and operated by the organization, or a third party or a combination of both. This model may reside either on-premises or off-premises. The community cloud is the cloud infrastructure designed exclusively for a specific community of consumers from organizations that have such as security requirement, compliance consideration, and policy. One or more of organizations in the community, a third party or some combination of them can manage, own, operate the community cloud. The community cloud can reside on-premises or off-premises. The hybrid cloud is the cloud infrastructure combining two or more cloud infrastructures such as private, public, or community (Mell & Grance, 2011). Figure 4 presents the full representation of cloud computing technology per NIST including the standard service models, deployment models, and essential characteristics.
Figure 4. Overview of Cloud Computing based on NIST’s
Definitions.
Cloud Computing Role in Big Data and Big Data Analytics
Cloud computing plays a significant role in BDA (Assunção et al., 2015). The massive computation and storage requirement of BDA brings the critical need for cloud computing emerging technology (Mehmood, Natgunanathan, Xiang, Hua, & Guo, 2016). Cloud computing offers various benefits such as cost reduction, elasticity, pay per use, availability, reliability, and maintainability (Gupta, Gupta, & Mohania, 2012; Kritikos, Kirkham, Kryza, & Massonet, 2017). However, although cloud computing offers various benefits, it has security and privacy issues using the standard deployment models of public cloud, private cloud, hybrid cloud, and community cloud.
American
Production and Inventory Control Society (2001), as cited in (Madanhire & Mbohwa, 2016) defined ERP as a method for
the effective planning and controlling of all resources needed to take, make,
ship and account for customer orders in a manufacturing, distribution or
service organization. This functions
integration can be achieved through a
software package solution offered by vendors to support the seamless
integration of all information flowing through the enterprise, such as
financial, accounting and human resources.
ERP is a business management
software that is designed to integrate
data sources and processes of the entire organization into a combined system (Bahssas, AlBar, & Hoque, 2015).
ERP system is a
popular solution which is used by the organization
to integrate and automate various processes, performance improvements, and cost
reduction. ERP provides business with a real-time view of its core business processes
such as production, planning, manufacturing, inventory management and
development (Bahssas et al., 2015). The ERP software is a
multi-module application that integrates
activities across functional departments such as production, planning,
purchasing, inventory control, product distribution, and order tracking. It
allows the automation and integration of business process by enabling data and
information sharing to reach best practices in managing the process of the
business.
ERP involves
various modules such as accounting, finance, supply chain, human resources,
customer information and others (Bahssas et al., 2015; Madanhire & Mbohwa, 2016). ERP production planning module is used to
optimize the utilization of manufacturing capacity, parts, components, and material resources. ERP purchases module is used to streamline
procurement of required raw materials, as it automates the process of
identifying potential suppliers, negotiating
prices, placing orders to suppliers and related billing processes. ERP inventory control module is used to facilitate the process of maintaining an appropriate level of stocks in the warehouse
through identifying inventory requirements, setting targets, providing
replenishment techniques and options, monitoring item usage, reconciling
inventory balances and reporting inventory status. ERP sales module is used for order placement, order scheduling, shipping and
invoicing. ERP marketing module is used to support lead generation, direct mailing campaign. ERP financial module is used to gather
financial data from various departments and generate reports such as balance
sheet, general ledger, trial balance.
ERP human resources (HR) module is used to maintain a complete employee database to include contact information, salary
details, attendance and so forth (Madanhire & Mbohwa, 2016).
Innovations in technology trends have forced ERP designers to establish new
development. Thus, new ERP system
designs are implemented to satisfy organizations and customers by evolving new
ERP business models. Furthermore, one of
the biggest challenges for ERP is to keep
speed with the manufacturing sector which has been moving rapidly from product-centric to customer-centric focus (Bahssas et al., 2015). Most ERP vendors are required to add a
variety of functions and modules to their
core systems.
The
implementation of ERP systems is costly, and
organizations should be careful when implementing it to ensure its
success. Some believe that ERP systems
could hurt their business because of the potential problems of ERP (Umble, Haft, & Umble, 2003). Various studies identified
success factors for ERP. (Umble et al., 2003) addressed
the most prominent factors for successful implementation of ERP. The first
critical success factor is that organizations should have a clear understanding of the strategic
goals. The commitment by top management
is another success factor. Successful
ERP implementation requires excellent project management. The existing organizational structure and processes found in
most enterprises are not compatible with the structure, tools, and types of
information provided by ERP systems.
Thus, organizational change management is required to ensure the successful implementation of ERP. ERP implementation teams should be composed
of highly skilled professionals that are chosen
for their skills, past accomplishments, reputation, and flexibility. Data accuracy is another success factor for
ERP implementation. The education and
training are another success factor for
the implementation of the ERP
system. (Bahssas et al., 2015) Indicated
that reserving 10-15% of the total ERP implementation budget for training will
give an organization an 80% chance of successful implementation. Focused performance measures must be included
from the beginning of the implementation because if the system is not associated with compensation, it will
not be successful.
Big Data Analytics plays a
significant role in ERP applications (Carlton, 2014; ERP Solutions, 2018; Woodie, 2016). Enterprise data comprises various departments
such as HR, finance, CRM and other essential business functions of a
business. This data can be leveraged to
make ERP functionality better. When Big
Data tools are brought together with the ERP
system, can
unfold valuable insights that can businesses make smarter decisions (Carlton, 2014; Cornell University, 2017; Wailgum,
2018). Many ERP
systems fail to make use of real-time inventory and supply chains data because these systems lack the
intelligence to make predictions about products demands (Carlton, 2014; ERP Solutions, 2018). Big Data tools can predict
demand and help determine what company needs to go forward (ERP Solutions, 2018).
Infor co-president Duncan Angove established Dynamic Science Labs (DSL)
aiming to use data science techniques to solve a particular class of business problems for its customers. Employees
with big data, math, and coding skills were hired in Cambridge, Massachusetts-based
organization to develop proof of concept (POC) (Woodie, 2016).
Big Data systems such as Apache’s Hadoop are creating node-level
operating transparencies which affect nearly every current ERP module in
real-time (Carlton, 2014).
Managers will be able to quickly leverage ERP Big Data capabilities,
thereby enhancing information density and speeding up overall decision-making.
In brief, Big Data and Big Data Analytics impact
business at all levels, and ERP is no
exception.
Customer
Relationship Management (CRM) systems assist organizations to manage customer
interaction and customer data, automate marketing, sales, and customer support, assess business
information and managing partner, vendor,
and employee relationships. A quality
CRM system can be scalable to serve the needs of small, medium or large
business (Financesonline, 2018). CRM systems can be customized to allow business is taking actionable customer insights
using back-end analytics, identify opportunities with predictive analytics,
personalize customer support, and streamline operations based on the history of
the customers’ interaction with the business.
Organizations must be aware of the CRM system software available to
select the most appropriate CRM system that can
better serve their needs.
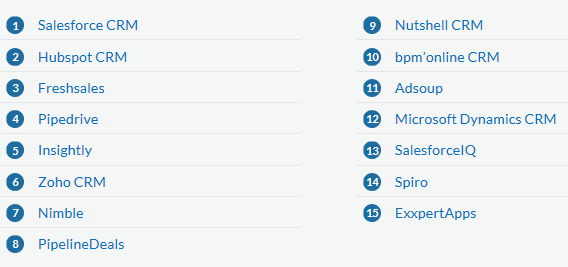
Various reports
identified various CRM systems. The best
CRM systems include Salesforce CRM, Hubspot CRM, Fresh sales, Pipedrive, Insightly, Zoho CRM, Nimble, PipelineDeals,
Nutshell CRM, Microsoft Dynamics CRM, SalesforceIQ, Spiro, and
ExxpertApps. Table 1 shows the best CRM
systems available in the market.
Table 1. CRM Systems (Financesonline, 2018).
Customer
satisfaction is the critical element to
the success of the business (Bygstad, 2003; Pearlson & Saunders, 2001). Businesses need to continuously satisfy
customers, understand their needs and expectations, provide high-quality
products or service at a competitive price to maintain success. These interactions needed to be tracked by the business and analyzed in an organized
way to foster long-lasting customer relationships which get transformed into long-term success.
CRM can aid
business increase sales efficiency, drive the satisfaction of customers,
streamline the process of the business and make it more efficient, and identify and resolve bottlenecks at any of the
operational processes from marketing,
sales to the product development (Ahearne, Rapp, Mariadoss, & Ganesan, 2012; Bygstad, 2003). The development of customer relationship is
not a trivial or straightforward task.
When it is done right, it places the
business in a competitive edge. However, the implementation of CRM is
challenging.
The implementation of
CRM demonstrates the value of customers to the business
and placing customer service on top priority
(Pearlson & Saunders, 2001). CRM plays a significant role in collaborating
the effort between customer service, marketing, and
sales in an organization. However, the
implementation of CRM is challenging especially for small business and
startups. Various reports addressed
various challenges when implementing CRM.
The cost is the most significant
challenges organizations are confronted
with when implementing the CRM solution (Sage Software, 2015). The development of a clear objective to
achieve with the CRM system is another challenge when implementing CRM. Organizations are confronted with the type of
deployment whether it should be on-premise or cloud-based CRM. Other challenges involve the employees’
training, the right CRM solution provider and the integration plan in advance (Sage Software, 2015).
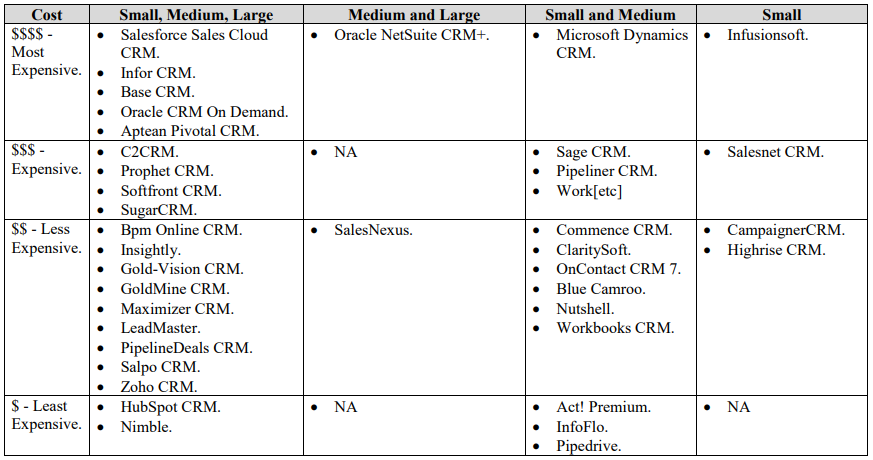
The cost of CRM systems
varies from one vendor to another based on the features and deployment key such
as data importing, analytics, email integrations, mobile accessibility, email
marketing, multi-channel support, SaaS platform, on-premise platform, and SaaS
and on-premise. Some vendors offer CRM
for small and medium, or small only, while others offer CRM systems for small,
medium and large businesses. In a report
by (Business-Software, 2019), the cost is categorized for more expensive to least
expensive using the dollar sign as $$$$ for most expensive, $$$ for expensive,
$$ for less expensive and $ for least expensive. Each vendor CRM system has certain features
which must be examined by organizations before making
the decision to adopt such a system.
Table 2 provides an idea about the cost from the most expensive, expensive, less expensive, to least expensive.
Table 2. CRM System Costs based on the Report by (Business-Software, 2019).
Understanding the
buildings blocks of the CRM system can assist in the implementation and
integration of CRM systems. CRM involves
four core building blocks (Meyer, Matthias & Kolbe, 2005). The acquirement and
continuous update of the knowledge base on the needs of customers, motivations,
and behavior over the lifetime of the
relationship with customers. The
application of the customers’ knowledge to continuously improve performance
through a process of learning from success and failures is the second building
block of CRM system. The integration of
marketing, sales, and service activities to achieve a common goal is another
building block of the CRM system. The
last building block of the CRM system
involves the implementation of appropriate systems to support customer
knowledge acquisition, sharing, and the measurement of CRM effectiveness.
CRM integration is a
critical building block for CRM success (Meyer, Matthias, 2005). The process of integrating CRM involves various organizational and operational
functions of the business such as marketing, sales and service activities. CRM requires detailed business processes
which can be categorized into three core
elements; CRM delivery process, CRM support process, and CRM analysis
process. The delivery process involves
direct contact with customers to cover part of the customer process such as
campaign management, sales management, service management, and complaint
management. The support process involves direct contact with the customer that are not designed to fulfill
supporting functions within the CRM context such as market research and loyalty
management. The analysis process
consolidates and analyzes the knowledge
of customers collected in other CRM processes.
The result of this analysis process is passed to the delivery process,
support process and to the service innovation and service production processes
to enhance their effectiveness such as customer scoring and lead management,
customer profiling and segmentation, feedback and knowledge management.
Various studies
and reports addressed best practices in the implementation and integration of CRM
systems into the business (Salesforce, 2018; Schiff, 2018). Organizations must choose a CRM that fits
their needs. Not every CRM is created equally, and if organizations choose
a CRM system without properly researching its features, capabilities, and weaknesses, organizations could end up committed to a system that is not
appropriate for the business, and as a result,
could lose money. Organizations should
decide whether CRM should be cloud-based
or on-premise base CRM (Salesforce, 2018; Schiff, 2018; Wailgum, 2008). Organizations should decide whether CRM
should be a service contract or one that
costs more upfront to install. Business
should also decide whether it needs in-depth, highly customizable features, or
basic functionality will be sufficient to serve the needs of the business. Organizations should analyze the options and
decide on the CRM system that is most appropriate for the business which can
serve the needs to build strong customer relationship and gain a competitive edge in the market.
Well-trained
personnel and workforce will help organizations achieve its strategic CRM goal.
If organizations do not invest in the
training of the workforce on how to utilize the CRM system, CRM tools will become useless.
The CRM systems become effective as organizations allow them to be. When
the workforce is not using the CRM system to its full potentials, or if the
workforce is misusing the CRM systems,
CRM will not perform its functions properly and will not serve the needs of the
business as expected (Salesforce, 2018; Schiff, 2018).
Automation is another critical factor for best practice when
implementing CRM systems. Tasks that are associated with data entry can be automated
so that CRM systems will be up to date.
The automation will increase the efficiency of the CRM systems as well
as the business overall (Salesforce,
2018; Schiff, 2018).
One of the significant benefits of
CRM is its potential in improving and enhancing the cooperative efforts across
departments of the business. When the
same information is accessible across various departments, CRM systems
eliminate confusions that can be caused by using different terms and different
information. Data without analysis is
not meaningless. Organizations should
consider mining the data to get the value
that can aid in making sound business decisions. CRM systems are designed to capture and
organize massive amounts of data. If
organizations do not take advantages of this massive amount of data to turn it
into actionable data, the implementation of CRM will be so limited. The
best CRM systems are those that come with built-in analytics features which use
advanced programming to mine all captured data and use that information to
produce valuable conclusions which can be used
for future business decisions. When
organizations take advantages of the CRM built-in analytical feature and analyze the data that CRM system
procures, the valuable information can provide insight for business decisions (Salesforce,
2018). The last element for best practice of the
implementation of CRM is for organizations to keep it simple. The best CRM
system is the one that will best fit the needs and requirements of the
business. The simplicity is a crucial
element when implementing CRM.
Organizations should implement CRM that is not complex while it is useful and provides everything the business
needs. Organizations should also
consider making changes to the CRM policies where necessary. The effectiveness of day-to-day operations will
be the best indicator of whether the CRM performs as expected, and if it is
not, some changes must be made until it
performs as expected (Salesforce,
2018; Wailgum, 2008).
This project
discussed critical information technology solutions used to gain competitive
advantages. The discussion began with
Big Data and Big Data Analytics addressing essential topics such as the Hadoop ecosystem, NoSQL databases, Spark
integration for real-time data processing, and Big Data Visualization. Cloud computing is an emerging technology to solve
Big Data challenges such as storage for the large volume of the data, and the
high-speed data processing to extract value from data. Enterprise Resource Planning (ERP) is a
system that can aid organizations to gain competitive advantages if implemented
right. The project discussed various
success factor for the ERP system. Big Data plays a significant role in ERP,
which is also discussed in this
project. The last technology addressed
in this project is the Customer Relationship Management (CRM), its building
blocks and integration. The project
addressed the challenges and costs associated with CRM. The best practice of CRM is addressed which can assist in the successful implementation of CRM. In summary, enterprises should evaluate
various information technology systems that are developed to aid them to gain
competitive advantages.
Ahearne, M., Rapp, A.,
Mariadoss, B. J., & Ganesan, S. (2012). Challenges of CRM implementation in
business-to-business markets: A contingency perspective. Journal of Personal Selling & Sales Management, 32(1), 117-129.
Alexandru,
A., Alexandru, C., Coardos, D., & Tudora, E. (2016). Healthcare, Big Data
and Cloud Computing. management, 1,
2.
Alguliyev,
R., & Imamverdiyev, Y. (2014). Big
data: big promises for information security. Paper presented at the
Application of Information and Communication Technologies (AICT), 2014 IEEE 8th
International Conference on.
Ankam,
V. (2016). Big Data Analytics: Packt
Publishing Ltd.
Armbrust,
M., Fox, A., Griffith, R., Joseph, A. D., Katz, R. H., Konwinski, A., . . .
Stoica, I. (2009). Above The Clouds: A Berkeley View of Cloud Computing. Electrical Engineering and Computer Sciences
University of California at Berkeley.
Assunção,
M. D., Calheiros, R. N., Bianchi, S., Netto, M. A. S., & Buyya, R. (2015).
Big Data Computing and Clouds: Trends and Future Directions. Journal of Parallel and Distributed
Computing, 79, 3-15. doi:10.1016/j.jpdc.2014.08.003
Bahssas,
D. M., AlBar, A. M., & Hoque, M. R. (2015). Enterprise resource planning
(ERP) systems: design, trends and deployment. The International Technology Management Review, 5(2), 72-81.
Bansal,
A., Deshpande, A., Ghare, P., Dhikale, S., & Bodkhe, B. (2014). Healthcare
data analysis using dynamic slot allocation in Hadoop. International Journal of Recent Technology and Engineering, 3(5),
15-18.
Business-Software.
(2019). Top 40 CRM Software Report.
Bygstad,
B. (2003). The implementation puzzle of CRM systems in knowledge based
organizations. Information Resources
Management Journal (IRMJ), 16(4), 33-45.
Chrimes,
D., Zamani, H., Moa, B., & Kuo, A. (2018). Simulations of
Hadoop/MapReduce-Based Platform to Support its Usability of Big Data Analytics
in Healthcare.
Dhotre,
P., Shimpi, S., Suryawanshi, P., & Sanghati, M. (2015). Health Care
Analysis Using Hadoop. Internationaljournalofscientific&tech
nologyresearch, 4(12), 279r281.
DuttaRoy,
S. (2016). SAP Business Analytics: A Best
Practices Guide for Implementing Business Analytics Using SAP: Springer.
EMC.
(2015). Data Science and Big Data
Analytics: Discovering, Analyzing, Visualizing and Presenting Data. (1st
ed.): Wiley.
Foster,
I., Zhao, Y., Raicu, I., & Lu, S. (2008). Cloud Computing and Grid Computing 360-Degree Compared. Paper
presented at the 2008 Grid Computing Environments Workshop.
Gantz,
J., & Reinsel, D. (2011). Extracting Value From Chaos. International Data Corporation, 1142, 1-12.
Géczy,
P. (2014). Big data characteristics. The
Macrotheme Review, 3(6), 94-104.
Gupta,
R., Gupta, H., & Mohania, M. (2012). Cloud
Computing and Big Data Analytics: What is New From Databases Perspective?
Paper presented at the International Conference on Big Data Analytics,
Springer-Verlag Berlin Heidelberg.
Hashem,
I. A. T., Yaqoob, I., Anuar, N. B., Mokhtar, S., Gani, A., & Khan, S. U.
(2015). The Rise of “Big Data” on Cloud Computing: Review and Open Research
Issues. Information Systems, 47,
98-115. doi:10.1016/j.is.2014.07.006
Hu,
H., Wen, Y., Chua, T., & Li, X. (2014). Toward Scalable Systems for Big
Data Analytics: A Technology Tutorial. Practical
Innovation, Open Solution, 2, 652-687. doi:10.1109/ACCESS.2014.2332453
Jayasingh,
B. B., Patra, M. R., & Mahesh, D. B. (2016, 14-17 Dec. 2016). Security issues and challenges of big data
analytics and visualization. Paper presented at the 2016 2nd International
Conference on Contemporary Computing and Informatics (IC3I).
Kaisler,
S., Armour, F., Espinosa, J. A., & Money, W. (2013). Big Data: Issues and Challenges Moving Forward. Paper presented at
the Hawaii International Conference on System Sciences
Karanth,
S. (2014). Mastering Hadoop: Packt
Publishing Ltd.
Kritikos,
K., Kirkham, T., Kryza, B., & Massonet, P. (2017). Towards a
Security-Enhanced PaaS Platform for Multi-Cloud Applications. Future Generation computer systems, 67,
206-226. doi:10.1016/j.future.2016.10.008
Lewis,
G. (2010). Basics About Cloud Computing. Software
Engineering Institute Carnegie Mellon University, Pittsburgh.
Madanhire,
I., & Mbohwa, C. (2016). Enterprise resource planning (ERP) in improving
operational efficiency: Case study. Procedia
Cirp, 40, 225-229.
Maltby,
D. (2011). Big Data Analytics. Paper
presented at the Annual Meeting of the Association for Information Science and
Technology.
Manyika,
J., Chui, M., Brown, B., Bughin, J., Dobbs, R., Roxburgh, C., & Byers, A.
H. (2011). Big Data: The Next Frontier for Innovation, Competition, and
Productivity. McKinsey Global Institute.
Mehmood,
A., Natgunanathan, I., Xiang, Y., Hua, G., & Guo, S. (2016). Protection of
Big Data Privacy. Institute of Electrical
and Electronic Engineers, 4, 1821-1834. doi:10.1109/ACCESS.2016.2558446
Mell,
P., & Grance, T. (2011). The NIST Definition of Cloud Computing. National Institute of Standards and
Technology (NIST), 800-145, 1-7.
Meyer,
M. (2005). Multidisciplinarity of CRM
Integration and its Implications. Paper presented at the System Sciences,
2005. HICSS’05. Proceedings of the 38th Annual Hawaii International Conference
on.
Meyer,
M. (2018). The Rise of Healthcare Data Visualization.
Meyer,
M., & Kolbe, L. M. (2005). Integration of customer relationship management:
status quo and implications for research and practice. Journal of strategic marketing, 13(3), 175-198.
Pearlson,
K., & Saunders, C. (2001). Managing and Using Information Systems: A
Strategic Approach. 2001: USA: John Wiley & Sons.
Raghupathi,
W., & Raghupathi, V. (2014). Big data analytics in healthcare: promise and
potential. Health Information Science and
Systems, 2(1), 1.
Sage
Software. (2015). Top Challenges in CRM Implementation.
Sahafizadeh,
E., & Nematbakhsh, M. A. (2015). A Survey on Security Issues in Big Data
and NoSQL. Int’l J. Advances in Computer
Science, 4(4), 2322-5157.
Schiff,
J. L. (2018). 8 CRM implementation best practices.
Scott,
J. A. (2015). Getting Started with Spark: MapR Technologies, Inc.
Umble,
E. J., Haft, R. R., & Umble, M. M. (2003). Enterprise resource planning:
Implementation procedures and critical success factors. European Journal of Operational Research, 146(2), 241-257.
Vaquero,
L. M., Rodero-Merino, L., Caceres, J., & Lindner, M. (2008). A Break in the
Clouds: Towards a Cloud Definition. Association
for Computing Machinery: Computer Communication Review, 39(1), 50-55.
Wang,
Y., Kung, L. A., & Byrd, T. A. (2018). Big Data Analytics: Understanding
its Capabilities and Potential Benefits for Healthcare Organizations. Technological Forecasting and Social Change,
126, 3-13. doi:10.1016/j.techfore.2015.12.019
The purpose of this discussion is to
address two good-quality research papers on customer relationship management
(CRM). The chosen articles for this
discussion are (Ngai, Xiu, & Chau, 2009;
Rygielski, Wang, & Yen, 2002). The reason for
selecting these two papers is that they discuss CRM in the context of business
intelligence and data mining.
The first journal (Rygielski et al., 2002) is about data mining techniques for CRM. The authors discussed various aspects of the
CRM as well as data mining. They also
discussed the importance of understanding the customers’ lifecycle and the data
mining techniques that can be used to extract value from the customers’ data. Various data mining techniques are discussed and their application with CRM.
The second journal (Ngai et al., 2009) is about the application of data mining techniques in CRM,
and a literature review and classification.
The authors identified nine hundred articles to the application of data
mining techniques to CRM. Seven data
mining techniques are identified to include association, classification,
clustering, forecasting, regression sequence discovery, and visualization. The
authors indicated that classification and association models are the two
commonly used models for data mining in CRM.
Four CRM dimensions are identified
as customer identification, customer attraction, customer retention, and customer development.
Customer Relationship Management (CRM)
(Rygielski et al., 2002) defined CRM using
four elements of a simple framework; know, target, sell and service. CRM includes a set of processes and enabling
systems to support the enterprise strategy
to develop long term, profitable relationships with specified customers (Ngai et al., 2009). The foundation for
successful CRM strategy involves the customers’ data and information technology
tools. The rapid growth of the internet
and the emerging technologies increased the opportunities for marketing and
transformed the way relationship between
business and customers are managed (Ngai et al., 2009).
Enterprises are required to know and
understand its market and customers, which involve detailed customer
intelligence to select the most profitable customers and identify those no
longer worth targeting (Ngai et al., 2009; Rygielski
et al., 2002). The target entails the products to be sold to
certain customers through specific channels. The selling element of CRM requires
enterprises to campaign management to increase the effectiveness of the
marketing department. Enterprises seek
to retain their customers through services such as call center and help
desk.
CRM Old Model and Relationship Marketing
Technology plays a significant role
in marketing. Relationship marketing has become a reality due to the technology
application and the advancement in technology (Ngai et al., 2009; Rygielski et al., 2002). Various enterprises
and businesses gained competitive advantages due to the application of
technologies such as business intelligence, data mining, data warehouse. Data mining technique assists organizations
to extract value from the data. When
organizations apply data mining techniques, they can determine valuable
customers and predict hidden behaviors and allowing businesses to make
proactive knowledge-driven decisions. Data
mining provides automated and future-oriented analysis which is beyond the past
events that are based on historical data (Rygielski et al., 2002).
The old model of ‘design-build-sell’
which is a product-oriented view is being replaced by ‘sell-build-redesign
which is a customer-oriented view (Rygielski et al., 2002). The new approach to
one-to-one marketing challenged the traditional process of mass-marketing. The marketing goal of the traditional
approach is to reach more customers and expand the customer base.
Two-Stage CRM Concepts
Customer Focus: The
first stage is to master the basics of building and developing customer focus.
This concept shifts the focus from product orientation to customer orientation and define market strategy
from outside-in and not from inside-out.
The focus should be on the needs of customers and not on the product’s features (Rygielski et al., 2002).
CRM Integration: The
second stage goes beyond the basics by integrating CRM across the entire
customer experience chain, leveraging technology to achieve real-time customer
management, and continuously innovating
the value proposition to customers (Rygielski et al., 2002).
CRM Components
Customer Data: CRM
involves several components. Enterprises
must first process customer information before the process of CRM begins. Customers data can be collected through internal customer data or external sources.
Customer internal data sources include summary tables that describe
customers via billing records, customer surveys of a subset of customers who
answer the detailed question, and
behavioral data contained in transaction systems such as weblogs, credit card records and so forth (Rygielski et al., 2002).
Data Warehouse: Data
warehouse is a critical component for a successful
CRM strategy. Data required for CRM can
be limited to a marketing data mart with limited feeds from other corporate
systems. External data sources can be a key
source for gaining customer knowledge advantage. These external data sources
include lookups for current address and phone, household hierarchies,
Fair-Isaacs Corp (FICO) credit scores, and webpage viewing profiles (Rygielski et al., 2002).
Analytical Tools: CRM
system must analyze the data using statistical tools, OLAP and data
mining. Marketing professionals are
required to understand the customer data and business imperative whether the
enterprise uses the traditional statistical techniques or one of the data
mining software tools. Enterprises should employ data mining analysts who will
be involved in the analysis and make sure the business does not lose sight of
the original reason for implementing the data mining technique. The
segmentation of the market is the result,
and decisions are made regarding which
segments are attractive (Rygielski et al., 2002).
Campaign Execution and Tracking: Enterprises should execute campaigns and track the
results. Campaign management software
manages and monitors the communications of customers across multiple
touchpoints such as direct mail, telemarketing, customer service,
point-of-sale, email, and the web.
People and processes contribute to facilitating
the interaction between marketing, information technology and sales channels (Rygielski et al., 2002).
Data Mining and Knowledge Discovery
Data mining is defined as a sophisticated data search capability using
statistical algorithms to discover correlations and patterns in data (Rygielski et al., 2002). The term data
mining is an analogy to the gold or coal
mining, indicating that data nuggets are buried
in the large volume of the corporate data warehouses, or information dropped on
a website, most of which can lead to better understanding and use of the
data. Data mining approach is
complementary to other analysis techniques such as statistics, on-line analytical
processing (OLAP), spreadsheets, and necessary
data access. In summary, data mining is
another approach to find meaning and value in the data that can aid enterprises
to make better strategic and tactic decisions (Ngai et al., 2009; Rygielski
et al., 2002).
When organizations apply data mining
techniques, they can discover patterns and relationships hidden in the data.
This process of discovering patterns and relationships is part of a more extensive process known as ‘knowledge
discovery” (Rygielski et al., 2002). The process of knowledge discovery describes the required
steps to ensure meaningful output. Data
mining does not eliminate the need for organizations to understand the data and
basic statistical methods. Data mining
does not find patterns or relationships that can be trusted blindly without
verification. The result must be verified.
Data mining assists in generating hypotheses. However, data mining does
not validate these hypotheses.
Data Mining Evolution and Building Blocks
Data mining evolved through four significant phases from the 1960s to 1980s, to 1990s, and 2000s (Rygielski et al., 2002). Data mining began
with the data collection in the 1960s for
simple calculations such as summations and average. The information at this phase answered
business questions related to figures derived from data collection sites, such
as the total revenue, or average total revenue over a specified period. Specific application programs were created for collecting data and
calculations. Data access is the second
data mining generation phase in the 1980s,
where databases were used to store data in a structured format. Organizations
were able to query the database to access certain
data for a specific period. In the 1990s,
data navigation phase began as a logical step after the data access where
organizations could obtain either a global view or drill down to a particular
site for comparison with its peers. In the
2000s, data mining phase began with the online analytic tools for real-time feedback
and information exchange with collaborating business units.
The primary building blocks of data mining have been developing for decades. These building blocks include statistics, artificial intelligence, and machine learning (Rygielski et al., 2002). These data mining core components are mature. When integrating these building blocks of the data mining with a relational database, they develop a business environment which can capitalize on knowledge previously buries within the systems. Figure 1 shows the core components of data mining.
Figure 1. Core Components of Data
Mining.
Data Mining Core Process
When using data mining, the data is formed and constructed into a model. The model describes patterns and relationships derived from the data. The implementation of data mining involves three general processes. The discovery phase is the process of looking in the database to find hidden patterns without pre-determined hypotheses about the patterns. The predictive phase is the process of taking the discovered pattern and using them for future prediction. The forensic analysis is the process of applying the extracted patterns to find anomalous or unusual data elements (Rygielski et al., 2002). Figure 2 illustrates these three essential processes.
Figure 2. Data Mining Three Core
Processes (Rygielski et al., 2002).
Data Mining Models and Benefits
Data mining has six types of data
models to solve various types of business problems; classification, regression,
association analysis, sequence discovery, clustering (Ngai et al., 2009; Rygielski
et al., 2002),
time series (Rygielski et al., 2002), and visualization (Ngai et al., 2009). Classification and
regressions are used to make predictions, while association and sequence
discovery is used to describe
behavior. Clustering model can be used for either forecasting or description. Prediction and descriptive data mining are used for retail, banking,
telecommunication, and other applications.
In the retail sector, retailers can
keep detailed records of every shopping transactions via store-branded credit
cards and point-of-sale systems. Retailers can better understand the various
customer segments. Retail applications
include performing basket analysis, sales forecasting, database marketing,
merchandise planning and allocation (Rygielski et al., 2002). The banking sector
can deploy knowledge discovery for
various applications such as card marketing, cardholder pricing and
profitability, fraud detection, and predictive life-cycle management. The telecommunications sector can utilize
knowledge discovery for various applications such as call detail record
analysis, and customer loyalty. Other knowledge discovery applications are
emerging in a variety of sectors such as customer segmentation, manufacturing,
warranties, and frequent flier incentives. For the forensic analysis, banks and
financial entities can use it for fraud detection to analyze the abnormalities
in the data.
Enterprises can integrate data
mining into the decision-making process. However, data mining implementation
requires skill sets and technology. While data mining is frequently implemented at the regional or central organization,
front line management and operations should have the knowledge gained through
the data mining. The communication of
this knowledge gained through data mining can be through an algorithm for
scoring, a score or a recommended action associated with a particular customer,
employee or a transaction (Rygielski et al., 2002).
Data Mining Techniques
Data mining techniques involve the retention-based technique and the distillation-based technique (Rygielski et al., 2002). The retention-based technique applies to tasks of predictive modeling and forensic analysis, and not to the knowledge discovery because they do not distill any patterns. The distillation-based technique has three categories; logical, cross-tabulation, and equational. These three methods extract patterns from a dataset and use the patterns for various purposes. The logical approach handles numeric and non-numeric data, while equations require all data to be numeric, and cross-tabulation work only with non-numeric data. Figure 3 shows the data mining techniques.
Figure 3. Data Mining Techniques (Rygielski et al., 2002).
Data Mining and CRM
CRM is a broad topic with many
layers, one of which is data mining, which is a method or tool that can aid
enterprises in their quest to become more customer-oriented. (Rygielski et al., 2002) discussed the customer lifecycle and the data mining that
can aid organizations to gain competitive
advantages and customer privacy.
Customer’s Lifecycle and Data Mining: CRM lifecycle involves the stages in the relationship between customer and the business. Enterprises can increase the customer’s value by increasing their use or purchase of products they already have, selling them more or higher-margin products, and keeping the customers for a more extended period. The customer relationship changes over time, evolving as the business and customer learn more about each other. The customer lifecycle involves four stages; prospects, responders, active customers former customers. The prospects customers are not yet customers but are in the target market. The responders are prospects who show interest in the product. The active customers are those who are currently using the product or service. The former customer is those who fall into various categories, such as bad customers who did not pay their bills, customers who moved their business to the competing products, customers who incurred a high cost, or customers who are no longer in the target (Rygielski et al., 2002).
Marketing Data Intelligence (MDI): Marketing data intelligence (MDI) is defined as “combining data-driven marketing and technology to increase the knowledge and understanding of customers, products, and transactional data to improve strategic decision making and tactical marketing activity, delivering the CRM challenge” (Rygielski et al., 2002). Enterprises should understand the customers’ lifecycle because it provides a good framework for applying data mining to CRM. The customer’s lifecycle tells what information is available on the input side of the data mining, and what is likely to be interesting on the output side of the data mining. Data mining can be used over some time to predict changes in detail. Enterprises can predict the behavior surrounding a particular lifecycle event such as retirement and find other people in a similar life stage and determine which customers are following similar behavior patterns. The marketing data intelligence is the outcome of this process.
Marketing Data Intelligence (MDI) Components: MDI involves two critical components; customer data transformation, and customer knowledge discovery. The raw data extracted and transformed from a wide range of internal and external databases, marts or warehouses. The collected data gets stored in a centralized location where it can be accessed and explored. The process is continued through customer knowledge discovery, where data mining is implemented, and useful patterns and inferences can be drawn from the data. The process must be measured and tracked to ensure results are pushed to campaign management software. Data mining plays a significant role in the process of CRM (Rygielski et al., 2002). The data mining process involves the interactions with data mart or warehouse in one direction, and the interaction with campaign management software in the other direction. The link between data mining and the campaign management was mostly manual. The trend today is to integrate the data mining and the campaign management to gain a competitive advantage. Enterprises can gain a competitive advantage from such integration by ensuring that the data mining software and the campaign management software share the same definition of the customer segment to avoid modeling the entire database. For instance, if the ideal segment is about high-income males with the age range of 25-35 living in the northeast, the analysis should be limited to this segment.
Data Mining and Customers’ Privacy: The
data mining provides various benefits to businesses. However, it can invade the
privacy of the customers. (Rygielski et al., 2002) argued that the
personalization of CRM is far from the invasion of the privacy. Personal information can be classified into
two categories; data provided and accessible to users, and data generated and
analyzed by businesses. Before data mining techniques became popular,
customer’s data was collected on a
self-provided or transactional basis.
Customers provide general descriptive data which contain demographic
data about themselves. The transactional
data refers to data obtained when a transaction takes place, such as product
name, quantity, location, and time of purchase. Data mining helps turn customer
data into customer profiling information, which belongs to the second
category. It includes customer value,
targeting information, customer rating, and behavior tracking. When abusing this information, people may
also suffer from certain forms of discrimination such as insurance or loss of
career. The central issue of privacy is
to find a balance between privacy rights for consumers’ protection and
businesses benefits.
(Rygielski et al., 2002) argued that privacy
is more of a policy issue than a technology issue. One basic principle for Enterprises when
using personalized technology is to disclose to their customers the kinds of
information they are seeking and how that information will be used.
While some list objectives for ethical information and privacy
management, others develop a Privacy Bill of Rights that includes fair access
by individuals to their personal information. The privacy of customers can be protected when customers do not have to
reveal their identities and can remain anonymous even after implementing data
mining. Various security measures such
as encryption and firewall should be implemented.
Conclusion
The
discussion involved two main articles that discussed data mining application
and CRM. The application of data mining
techniques in CRM is an emerging trend in the industry. The relationship between business and customers
are taking a different path in the presence of the Internet, and Big Data Analytics
techniques such as data mining.
Enterprises are under pressure to gain a competitive advantage using
data mining techniques to extract value from customers’ data. Enterprises are
also under pressures to ensure the protection of the customer’s private
information. Various data mining
techniques are available such as statistics and machine learning. Enterprise should apply the appropriate data
mining technique to CRM strategy to gain competitive
advantages by not only gaining customers but also retaining the customers.
References
Ngai, E. W., Xiu, L., & Chau, D.
C. (2009). Application of data mining techniques in customer relationship
management: A literature review and classification. Expert Systems with Applications, 36(2), 2592-2602.
Rygielski,
C., Wang, J.-C., & Yen, D. C. (2002). Data mining techniques for customer
relationship management. Technology in
society, 24(4), 483-502.
In the age of big data, a considerable variety, volume, and velocity of data are being generated. The data are being generated by people, machines, the Web, and information systems. Harnessing these data and making sense of them in real time or near real time to develop actionable intelligence is one of the big challenges facing organizations. Data are stored in warehouses, and they are then mined to generate insights. Analytical techniques that are used include statistical techniques, machine learning, and others. The purpose of this discussion is to address the challenges and benefits of data warehousing and data mining techniques.
Data Warehousing
Data warehousing is defined as a subject-oriented, integrated, time-variant, and
non-volatile collection of data in support of the decision-making process (Connolly & Begg, 2015). Since the 1970s, enterprises have mostly focused their
investment in a new information system
that automates a business process. Businesses
gained competitive advantages through these systems that provided more
efficient and cost-effective services to customers. Organizations have been stored the data in the operational databases — however, the operational database designed for daily operations and not to be
part of the decision-making process.
Enterprises faced the challenge to turn the archived data into a source
of knowledge. The concept to data
warehouse was emerged as the solution to meet this requirement of a capability
system supporting decision making and receiving data from various operational
sources (Connolly & Begg, 2015; Coronel
& Morris, 2016).
The concept of data warehouse (DW) was devised by IBM as “information warehouse” as a solution for accessing data held in non-relational systems (Connolly & Begg, 2015). It was proposed to allow businesses to use the archived data to aid them to gain a business advantage. However, due to the complexity of the implementation, the early attempts at creating an information warehouse were mostly rejected. The concept of data warehousing has been raised several times since then. However, in recent years, the potential of data warehousing has been viewed as a valuable and viable solution to businesses. Bill Inmon is regarded to be the father of DW as he was one of the earliest promoters of data warehousing (Connolly & Begg, 2015; Guohong, Lijun, Junhui, & Peixin, 2010).
Data Warehouse Characteristics The database for data warehouse (DW) is another type
of database in management information system acting as ‘one-stop shopping” and focusing on supporting informed and
actionable decision making (Ally & Khan, 2016; Coronel
& Morris, 2016).
It is a central location for knowledge creation to mitigate the challenge
of various independent sources of data.
This type of database is distinguished
from other databases such as a transactional
or operational database (Ally & Khan, 2016; Coronel
& Morris, 2016).
DW unlike the operational database collects consolidated and summarized
data used in the decision-making process.
DW has four significant characteristics
proposed by two DW icon known as Kimble and Inmon. The integrated,
subject-oriented, time-variant, and non-volatile are the primary four characteristics of DW (Ally & Khan, 2016; Connolly
& Begg, 2015; Coronel & Morris, 2016).
Data Warehouse Architecture Various studies proposed a various architecture for the data warehouse. The selected architecture for this discussion includes CRM, and ERP (Guohong et al., 2010). CRM integrates the scattered, isolated data in the enterprise for a comprehensive and complete understanding of customers. Online analytical processing technology (OLAP) is a software technology allowing analysis and managers to access the data fast, consistently, and interactively. Figure 1 shows the holistic view of the data warehouse framework.
Figure 1. A Holistic View of DW
Framework (Guohong et al., 2010)
Benefits and Challenges of Data Warehousing The successful implementation of the data warehouse
can bring significant advantages to
business. Enterprises can gain potential
high returns on investment, competitive advantage, and increased the productivity of corporate
decision makers. As cited in (Connolly & Begg, 2015), data warehouse projects delivered an average three-year return on
investment of 401%. This high ROI posits
these enterprises which successfully implemented the data warehousing projects
into a competitive advantage. Businesses
gain competitive advantages when allowing decision makers to access the data
that can reveal previously unavailable, unknown and untapped information on customers,
products, trends, and demands. The successful implementation of the data
warehousing improves the productivity of enterprise
decision makers by creating an integrated database of consistent,
subject-oriented, and historical data.
The data warehouse can integrate
data from various independent data sources
and transform this data to meaningful information providing decision makers
with substantive, accurate and consistent analysis (Connolly & Begg, 2015; Coronel
& Morris, 2016).
Data warehousing is confronted with various challenges. Underestimation of resource for data ETL
(extract, transform and load) process is one of the significant challenges (Connolly & Begg, 2015; Coronel
& Morris, 2016).
Hidden problems with source systems
and required data are not captured are
other challenges that data warehouse faces.
Other challenges include increased end-user demands, data
homogenization, high demand for resources, data ownership, high maintenance,
long-duration projects, and complexity of integration. In the era of Big Data and Big Data
Analytics, a data warehouse is confronted with additional challenges of new
technologies such as Hadoop, MapReduce, Cloud Computing and so forth. The data
warehouse was initially designed for
historical data. However, with BDA, real-time (RT) and near-real-time (NRT), a data warehouse is
required. Thus, the demand is
increased to design DW to enable RT/NRT extraction, modeling RT fact table, and
scalability and query contention (Connolly & Begg, 2015; Coronel
& Morris, 2016)
Data Mining
Data warehouse, OLAP and data
mining are essential technologies forming critical
components of the Business Intelligence implementation (Connolly & Begg, 2015). The value of the data warehouse is determined by providing the data to end
users using the appropriate analytical tools such as data mining and OLAP (Connolly & Begg, 2015). Because OLAP and data mining analytical tools
are distinguished in what they offer to
the end users, they are regarded as
complementary technologies (Connolly & Begg, 2015). While OLAP employs advanced data analysis and
presentation tools including the multi-dimensional data analysis, data mining
provides advanced statistical tools not only to provide analysis of the large data available through the data
warehouses and other sources but also to
identify the possible relationships and anomalies (Connolly & Begg, 2015).
Data mining is “the process
of discovering meaningful new correlations, patterns, and trends by mining large
amounts of data using statistical, mathematical, and AI techniques. Data mining has the potential to supersede
the capabilities of OLAP tools, as the major attraction of data mining is its
ability to build predictive rather than retrospective models” (Connolly & Begg, 2015).
While the traditional BI tools are
“reactive,” data mining is regarded to be “proactive” as the end users do not
have to identify the problem, and select the data to be analyzed by the
traditional BI tools, but rather data mining tools identify the problem by
automatically searching the data for anomalies and possible relationship (Coronel & Morris, 2016). Thus, data mining involves four tasks: (1)
analyzing the data, (2) discovering the problems or opportunities that might be
hidden in the relationship of the data, (3) formulating a model that is based
on the findings, (4) utilizing the model to predict behavior of the business,
which requires minimal intervention from the end users (Coronel & Morris, 2016). As a result of these activities, the business
can use the findings to obtain knowledge that can lead to competitive
advantages (Coronel & Morris, 2016). In summary, data mining is described as the analytical tool that
“initiate analyses to create knowledge” (Coronel & Morris, 2016). This knowledge represents very specialized
information (Coronel & Morris, 2016).
Data
Mining Techniques
Data mining techniques involve four essential operations: (1)
“Predictive Modeling,” (2) “Database Segmentation,” (3) “Link Analysis,” and
(4) “Deviation Detection.” (Connolly & Begg, 2015). The “Predictive Modeling” operation
implements the classification and prediction technique. The “Database Segmentation” operation
implements demographic clustering and
neural clustering techniques (Connolly & Begg, 2015). The “Link Analysis” operation implements
association discovery, sequential pattern discovery, and similar time sequence
discovery techniques (Connolly & Begg, 2015). The “Deviation Detection” operation
implements the statistics and visualization techniques (Connolly & Begg, 2015). Although business can implement any of these
four operations, the certain association
between the business applications and the data mining techniques (Connolly & Begg, 2015). For instance, the “Retail/Marketing” applies
“database segmentation operation,” while the “Fraud Detection” applies any of
the four operations (Connolly & Begg, 2015).
The Machine Learning
Algorithm “Supervised” and “Non-supervised” learning techniques are the most common machine learning algorithm that is implemented in various domains, particularly
the “Data Mining” domain (Hall, Dean, Kabul, & Silva, 2014). Supervised learning algorithm (SLA) is a
technique that is used to label data to train a model (Hall et al., 2014).
It is comprised of “Prediction”
(“Regression”) algorithm, and “Classification” algorithm. The “Regression” or “Prediction” algorithm is
used for “interval labels,” while the “Classification” algorithm is used for
“class labels” (Hall et al., 2014). In the SL algorithm, the training data
represented in observations, measurements, and so forth are associated by labels reflecting the class of the observations (Han, Pei, & Kamber, 2011). The new data is classified based on the
“training set” (Han et al., 2011).
The unsupervised learning algorithm (ULA) occurs when a model is trained on
unlabeled data (Hall et al., 2014). UL algorithm typically segments data into
“groups of examples” called “Clusters” or “groups of features” called “Feature
Extraction” (Hall et al., 2014). The UL technique can be either the “end goal
of a machine learning task,” as the case with “Market Segmentation,” or a
“preliminary or pre-processing step in a supervised learning task” (Hall et al., 2014). When using the UL algorithm, the class labels
of training data is “unknown” (Han et al., 2011). UL algorithm is used to establish the
existence of class or clusters in the data, given a set of measurements, and
observations (Han et al., 2011).
Benefits
and Challenges
The goal of data mining is to
extract value from data. Enterprises can
utilize this information to make sound decisions to gain competitive advantages (Che, Safran, & Peng, 2013).
Organizations can benefit from data
mining in discovering concept/class descriptions, associations and
correlations, classification, prediction, clustering, trend analysis outlier,
and deviation analysis in making strategic and tactic decisions (Hand, Mannila, & Smyth, 2001; Linoff & Berry, 2011; Rygielski,
Wang, & Yen, 2002). However, data mining is confronted with various challenges include the development of
parallel or high-performance algorithms, theoretical models, and data mining
techniques (Dubitzky, 2008). Distributed data mining algorithms should
support the complete data mining process from pre-processing, to data mining,
to post-processing. The design of new
data mining systems and architectures to deal with efficient use of computing
resource is another challenging area for data mining. More development challenges in several areas
such as the high complexity of many data mining applications, the various data
sources with various data models, the volume of the data (Dubitzky, 2008).
Conclusion
This discussion addressed two significant topics of data warehouse and data mining. It began with the discussion about data warehouse, its evolution using information warehouse by IBM. Due to the complexity, the concept disappeared for a while but surfaced again. Bill Inmon is the father of the data warehouse. The benefits of the data warehouse are tremendous to businesses. However, data warehouse project implementation is confronted with various challenges especially in the age of Big Data Analytics and emerging technologies such as Hadoop. Data mining is another technique that organization embraces to extract value from the data. Data mining has various mining techniques including supervised and non-supervised algorithms. Like data warehouse, data mining makes organization gain a competitive edge. However, same as the data warehouse, data mining is also confronted with various challenges. Organizations should analyze each technique before embracing the technology to understand the benefits as well as the challenges.
References
Ally, S. S.,
& Khan, N. (2016, 15-17 Dec. 2016). Data
Warehouse and BI to Catalize Information Use in Health Sector for Decision
Making: A Case Study. Paper presented at the 2016 International Conference
on Computational Science and Computational Intelligence (CSCI).
Che, D., Safran,
M., & Peng, Z. (2013). From Big Data
to Big Data Mining: Challenges, Issues, and Opportunities. Paper presented
at the International Conference on Database Systems for Advanced Applications.
Connolly, T.,
& Begg, C. (2015). Database Systems:
A Practical Approach to Design, Implementation, and Management (6th Edition
ed.): Pearson.
Dubitzky, W.
(2008). Data Mining in Grid Computing
Environments: John Wiley & Sons.
Guohong, G.,
Lijun, X., Junhui, F., & Peixin, Q. (2010). The building of Customer Relationship Management system based on OLAP.
Paper presented at the Industrial Mechatronics and Automation (ICIMA), 2010 2nd
International Conference on.
Hall, P., Dean,
J., Kabul, I. K., & Silva, J. (2014). An Overview of Machine Learning with
SAS® Enterprise Miner™. SAS Institute Inc.
Han, J., Pei, J.,
& Kamber, M. (2011). Data mining:
concepts and techniques: Elsevier.
Hand, D. J.,
Mannila, H., & Smyth, P. (2001). Principles
of data mining.
Linoff, G. S.,
& Berry, M. J. (2011). Data mining
techniques: for marketing, sales, and customer relationship management:
John Wiley & Sons.
Rygielski,
C., Wang, J.-C., & Yen, D. C. (2002). Data mining techniques for customer
relationship management. Technology in
society, 24(4), 483-502.
The purpose of this projectis to discuss the trade-off between cost, time and quality of projects. Various essential topics related to projects and project management are discussed. The discussion begins with the distinct characteristics of the projects and operations, among which projects are temporary while operations are repetitive. The project addressed the project cycle plan and project development tools. Various tools for project management include project evaluation and review techniques (PERT), critical path method (CPM) and Gantt Chart. The project management with the trade-off between time, cost and quality are addressed. A balance of these three critical elements is required. This project discusses the project trade-off and the correlation between time and cost. Some argue that most businesses are cost-time bias at the expense of quality. Various projects success factors are also discussed in this project. Various factors cause projects to fail. These factors include misunderstanding of the project requirement, organizational influences, and risk management. Failed projects take a long time to be abandoned or corrected due to logistical problems, political thinking and lack of planning for uncertainty, and risk management.
Keywords:
Project Management, Cost, Time, Quality.
Enterprises achieve their strategic goals using various project
management techniques. Business requires
good performance assessment tools for project management to make sound decision
to gain and maintain a competitive edge in the market (Anuar & Ng, 2011). Management
and executives are under pressure to complete projects within a specific time, a
specific budget while maintaining the quality, which is considered to be the
success factors for project implementation.
This project discusses these factors for project management. It begins
with the discussion of projects vs. operations, followed by the project cycle
plan and project development tools.
A project is defined as a temporary venture to implement
a unique service or product. The temporary indicates a period that has a
beginning and ending, while unique indicates the service or product will be
distinguished from the ones in the market (Pearlson & Saunders, 2001; PMI, 2000). It is also defined as an
organization of people dedicated to a specific purpose or object (Pinto & Slevin, 2015). Projects consist of a set of
one-time actions to shift the present event into a new one based on the
strategic plan of the enterprise (Pearlson & Saunders, 2001; PMI, 2000). Projects involve substantial, expensive,
unique or high risk and must be completed within a time frame using a certain
amount of investment (Pinto & Slevin, 2015). Projects need to have
well-identified objectives and sufficient resources to implement all the
required tasks and activities (Pearlson & Saunders, 2001; PMI, 2000). The successful strategy of the enterprise requires two types of decisions;
one for the daily operatives, and another for the strategic objectives. Since IT plays a significant role in all
projects of the enterprise, IT project management plays a critical role in the
success of the business.
Projects and operations utilize the resources of the
business to transform them into profits.
Human resources and the flow of resources are required for projects and
operations of the business. A project
can be divided into sub-projects to implement particular activities such as
quality control testing (Pearlson & Saunders, 2001). During this sub-division of a
project, sourcing decisions are made to limit costs. Various projects are organized at a high
level, and elements of a more extensive program which provide a framework from
which competing resource requirements are managed, and priorities among a set
of projects are shifted.
Projects and operations have the same elements such as labor skills, training time, worker autonomy, compensation system, material input requirements, supplier ties, raw materials inventory, scheduling complexity, quality control, information flows, worker-management communication, duration and product or service (Pearlson & Saunders, 2001). However, each element has a different characteristic of the project and the operation. For instance, operations require low labor skills, training time, worker autonomy, while projects require them high. Compensation is a lump sum for projects, while hourly or weekly wage for operations. Material input requirements for operations require a high degree of certainty, while projects are uncertain. Information flows, and worker-management communication is essential in projects, while less critical in operations. The duration is on-going for operations, while temporary for projects. The product or service is repetitive in operation, while unique in projects. Table 1 shows the characteristics of operations and projects (Pearlson & Saunders, 2001).
Table 1. Projects vs. Operations (Pearlson & Saunders, 2001).
Enterprises develop the operations of the business
based on a strategic plan that has goals and objectives (Wilson, 2015). Resources get
acquired and managed to implement the plan. The project plan is comprised of
sequential steps for organizing and tracking the work of the team which
implements the project, while the project management contains a set of tools to
balance the competing demands for resources and ensure the completion of the
work at every step and evolves throughout the project plan (Pearlson & Saunders, 2001).
The project cycle plan organizes
the activities of the project and sequences them in steps along a timeline so
that the project delivers based on the requirements of the stakeholders and
customers. The plan is bounded by a critical beginning and end dates and breaks
the work into phases (Pearlson & Saunders, 2001). The plan
identifies the resources and time required to complete the work based on the
scope of the project. The tasks are identified and assigned to team members. The management tracks the progress and the
phases of the project and coordinates the eventual transition from the project
to operational status, a project that leads to the milestone of the project by
delivering it. The project progress is
monitored to ensure it meets the requirements of the cost, time, and
quality. If the project does not meet
the requirements, some corrections must be made, and the cycle gets adjusted as
required (Copertari, 2002; Pearlson & Saunders, 2001).
Various approaches and
software tools exist for the development of the project. Three main approaches include project evaluation
and review techniques (PERT), critical path method (CPM), and Gantt Chart (Pearlson & Saunders, 2001). PERT method
identifies the tasks of the project, orders the tasks in a time sequence,
identifies the interdependencies of the tasks, and estimates the time which is required
to complete each task. Tasks are divided
into critical and non-critical. The critical tasks must be performed
individually and together impact the total elapsed time of the project, while
the non-critical tasks include slack time without impacting the duration of the
entire project. Figure 1 shows an example of a PERT chart for a project plan.
Figure 1. PERT Chart (Pearlson & Saunders, 2001).
The CPM is another project planning and scheduling
tools. CPM is similar to PERT. However,
unlike PERT, CPM can identify relationships between costs and completion date
of a project, the amount and value of resources which can be applied as
alternatives (Pearlson & Saunders, 2001). CPM and PERT
are different in term of time estimates.
PERT develops broad estimates about the time needed to complete the
tasks of the project, calculating the optimistic, most probable and pessimistic
time estimates for each task. CPC, in
contrast, assumes that all time requirements for completion of each task are
relatively predictable. CPM tends to be
used on projects for which direct relationships can be established between time
and costs.
Gantt charts are used mostly for displaying time relationships of the tasks of the project and for monitoring the progress toward project completion. Gantt charts list project task with a bar for each task indicating the relative amount of time expected to complete the task (Pearlson & Saunders, 2001). The due date for completion is regarded as a milestone and noted with diamonds. Gantt charts are useful for planning purpose at the beginning of the project. When the project progresses, the chart is altered to reflect the extent to which each task is completed at the time the project is monitored. Figure 2 illustrates an example of a Gantt chart for a project.
Project management is defined as the application of skills, knowledge, techniques, and tools to implement activities to meet or exceed the needs of the stakeholders and the expectation from a project (Pearlson & Saunders, 2001). Project management involves a continuous trade-off between cost, quality and time. Managers and executives are confronted with a serious decision among these triangle constraints for projects implementation, involving the scope of the project. The scope can be divided into product scope and project scope. The product scope includes a detailed description of the quality of the product, features, and functions, while the project scope involves the work required to deliver a product or service with the intended product scope. Time refers to the period that is required to complete a project, while cost involves all the required resources to implement the project. Figure 3 shows the triangle of project management.
Any modification in any of these three sides of the
project triangle can have an impact on either side or both of the other sides. For instance, if the scope of the project
increases, more time and more cost will be required to implement the additional
work. The increase in the scope after
the project started is known as scope
creep. One or two of these project
triangle elements can be optimized, modifying the third to maintain the
balance. For instance, a project with a
fixed time and a fixed budget can restrict the scope, while a project with a
short time and a broad scope need budget flexibility. The trade-off among these project elements plays
a crucial role in business, as it can lead to a disastrous event such as Titanic.
The use of substandard low-grade rivets makes ships sink when hitting an
iceberg. The history showed that the
quality trade-off to using these low-grade reverts to lower the cost of some
parts of Titanic causes a disastrous
event. Managers and executives are under
pressure to balance among these project elements to ensure the success of the
project and eventually the success of the business.
The nature of the underlying tradeoffs can be illustrated using a systematic approach (Copertari, 2002). The systematic relationship between time and cost is illustrated in Figure 4 (a). If the project is delayed, it costs more money which is supported by studies such as (Anuar & Ng, 2011; Atkinson, 1999; Bowen, Cattel, Hall, Edwards, & Pearl, 2012). This relationship is a positive correlation between time and cost. Additional resources are required to deliver on time which can be directed to critical activities. Limited resources should be directed to non-critical activities, which is called crashing and it has a negative correlation between cost and time. The nature of the activities as critical and non-critical and the existing of both positive and negative correlation implies the existence of an equilibrium where an optimal project completion time is achieved at a minimum cost. Figure 4 (b) illustrates how the time/cost tradeoff is influenced by performance. The quality can be improved by using more resources, which increases the financial cost and will increase the time if such resources are limited. However, if more resources are invested and the project is taken more time to complete, the cost increases, the Internal Rate of Return (IRR) of the project measuring the profitability is reduced. Thus, enterprises must maintain an optimal time/cost tradeoff that can yield optimal project performance as measured by its IRR (Copertari, 2002).
Figure 4. Time, Cost and Performance
Tradeoffs (Copertari, 2002).
Various studies discussed various factors affecting
the success of projects. (Thamhain, 2004) examined the influences of the project environment on
team performance. The result showed that
a general agreement existed on the factors that drive team performance, and a
large number of performance factors derived from the human side is the most
significant findings. Project success is
based on the effectiveness of multi-disciplinary efforts across various teams (Thamhain, 2004). (Hong, 2011) suggested that the initiation and planning phases of
capital projects impact the outcome of completed cost, time and
profitability. (Bonner, Ruekert, & Walker Jr, 2002) examined formal and interactive control mechanisms
available to upper-managers in controlling new product development (NDP)
projects, and the relationship between these techniques and the NDP project
performance. The findings indicated that the degree to which upper-management
intervened in project-level during the project was negatively related to
project performance. The results also
showed support for the notion that early and interactive decision-making on
control mechanisms is critical for effective projects.
Other studies discussed cost, time and quality as
success factors for project implementation and management. (Atkinson, 1999) indicated that the Iron Triangle of time, cost, and
quality is still preferred success criteria for projects. Time is an intangible resource binding the
period of the project from the start to the completion (Anuar & Ng, 2011; Pearlson & Saunders, 2001). Time plays a significant role in the success
of the project as it is regarded as a significant criterion for project success
(Anuar & Ng, 2011; Bowen et al., 2012). The longer
the project takes, the potential damage is expected, the more complex and
costly the corrective measures will be to the project. Some argue that the projects with a short
time frame for completion have advantages cost and performance wise, while
others argue that when the projects are under time and cost pressure, the
quality is profoundly affected (Anuar & Ng, 2011; Pollack-Johnson &
Liberatore, 2006). (Bowen et al., 2012) suggested that time-cost bias exist, indicating
quality is last to consider.
Every project requires financial resources reflecting
the costs. The cost of the project plays another significant role in the
success of projects implementation (Westland, 2018; Wilson, 2015). Some suggest that when the cost increases when the
duration is shortened, and vice versa.
However, most large and complex project development require substantial
financial resources and schedule overrun (Anuar & Ng, 2011). The delayed
and more time projects require more financial resources (Bowen et al., 2012; Shankar, Raju, Srikanth, &
Bindu, 2014).
Products or service without quality can bring a business
down. Quality is defined as one of the
components that contribute to value for money (Bowen et al., 2012). Enterprises
must pay attention to the quality of products and services. The high failure rates of quality suggest
that the knowledge of the transformation process whereby ideas are turned into
successful quality products and services is far from perfect (Anuar & Ng, 2011). Organizations
are under pressure to introduce new products and adopt new processes to gain
and maintain competitive advantages.
(Anuar & Ng, 2011) analyzed three different scenarios and modeling using
Microsoft Office Project tool. The first
scenario is about project fixed time with limited resources. The second scenario is about project time
reduced with minimus cost imposed. The
last scenario is about maintaining quality while reducing the project
duration. The findings of the first
scenario showed that cost was controlled very tightly even though the time of
the project was not required to be reduced.
These findings are similar to the findings of (Olson, Walker Jr, Ruekerf, & Bonnerd, 2001). The findings
of the second scenario showed that the reduced time of the project could reduce
the cost of the project. The findings of
the last scenario showed that a shorter duration was not considered due to the
risks of having quality issues (Nidumolu, 1996) argued that the tight control of the process could
result in strict adherence to time and cost estimates. Such control impacts the functionality of the
product, thereby the long-term flexibility of technology is jeopardized with
the short-term user needs.
Various studies discussed reasons for projects
management failure. (Atkinson, 1999) identified two types of errors for project failure;
Type I and Type II. Type I errors occur
when something is done wrong, while Type II errors occur when something has not
been done as well as it could have been or something was missed. (Gardiner & Stewart, 2000) examined the relationship between project budgets,
cash flow cost control and schedule.
Each element plays a significant role in the net present value (NPV) of
a project. The NPV can be used as a
technique to monitor the health of the project, and whether it is meeting the
objectives within the time and cost identified.
The failure of a project is measured by the net present value (Gardiner & Stewart, 2000).
When a project absorbs a delay to a deliverable on the
critical path, five options are available (Gardiner & Stewart, 2000). The first
option is to move the milestone date. The second option is to reduce the scope
of the deliverable. The third option is to reduce the quality of the
deliverable. The fourth option is to apply additional resources generally workforce
or money. The last option is to
rearrange the workload. However, another
investment appraisal is not carried in most cases to assist in determining what
the most appropriate action is. The
point is that the logistical problems and political thinking play a role within
a project and the project managers should not ignore these facts. These logistical problems and political
thinkings play a role in taking a long time in abandoning a project or
correcting a project (Gardiner & Stewart, 2000).
Understanding the requirement of the project play a significant role in the success of the project. Thus, the lack of understanding of the requirements of the project can lead to a different outcome, delayed project, or failed project (Forsberg, Mooz, & Cotterman, 2000). The requirement of a project begins with the customer’s needs, and not with the perception of the organization to the customer’s needs. There is an ongoing danger of misunderstanding and ambiguity in the end-to-end chain of technical, business and project development. This misunderstanding leads to non-essential, overspecified, unclear or missing requirements as illustrated in Figure 5, which is a cartoon. Such projects are subject to failure.
Figure 5. Misunderstanding Project
Requirements Leads to Project Failure (Forsberg et al., 2000).
Moreover, project managers are confronted with various
influencing factors including technical, organizational, and socioeconomic
influences, which are relatively unique to IT projects (Pearlson & Saunders, 2001). Technical issues are related to business and budget
issues. Management which does not feel
comfortable with technology often take one of these actions; either ignore the
IT issues or delegate them to information system organization or focus
inappropriate attention on managing the technology to counter their fear. The managerial and socioeconomic influence involves
the control systems used for non-project-based operations which do not efficiently
support the project management. The
organizational culture has an impact on the leadership style of the project
management, and communication between team members. The socioeconomic impact on
projects includes government and industry standards, globalization, and
cultural issue.
The IT projects have a higher risk than non-IT
projects (Pearlson & Saunders, 2001). The term risk is not well understood among various
project management. The risk is defined as the possibility of the additional
cost or loss due to the alternatives are chosen. Some alternative has a lower risk than
others. Risk can be measured and
quantified by assigning a probability of occurrence and a financial consequence
to each alternative. Risk involves
complexity, clarity, and size (Pearlson & Saunders, 2001). The more
complexity of the project, the higher is the risk associated with the
project. The more ambiguous the project,
the higher the risk, and the bigger the size or scope of the project, the higher
is the risk. There is a positive
correlation between risk and these three risk elements.
The management of these risks can aid in turning the
troubled projects into a successful one.
(Pearlson & Saunders, 2001) argued that trouble projects persist long before they
get abandoned. The amount of money invested on the trouble project biases
management toward continuing to fund the project even if the success of the
project is questionable. Other factors
include the penalties for failure within the organization that can be high;
project management is willing to go for a more extended period even if it means
more resources including cost. Emotional
attachment to the project can cause prolonged projects that are subject to
failure.
This project
discussed various essential topics
related to projects and project management.
It began with the unique
characteristics of the projects and operations, among which projects are
temporary while operations are repetitive.
The project cycle plan and project development tools are also discussed.
Various tools for project management were also discussed. These
tools include project evaluation and review techniques (PERT), critical path
method (CPM) and Gantt Chart. Project
management involves various elements including cost, time and quality. The
project also discussed project trade-off
and the correlation between time and cost.
Some argue that most businesses are cost-time bias at the expense of
quality. Various projects success
factors were also discussed in this project,
such as the balance between cost, time and quality. Various factors cause projects to fail. These
factors include misunderstanding of the project requirement, organizational
influences, and risk management. Failed projects take a long time to be abandoned or corrected due to logistical problems,
political thinking and lack of planning for uncertainty. Although the success of a project is
questionable, the management persists in implementing, and it takes a long time
before it gets abandoned or to put under control. Various factors contribute to
this phenomenon including the penalty for failing projects, lack of
understanding to risk management, and the emotional attachment to the
project.
Anuar, N. I., & Ng, P. K. (2011). The role of time, cost and quality in
project management. Paper presented at the Industrial Engineering and
Engineering Management (IEEM), 2011 IEEE International Conference on.
Atkinson,
R. (1999). Project management: cost, time and quality, two best guesses and a
phenomenon, its time to accept other success criteria. International journal of project management, 17(6), 337-342.
Bonner,
J. M., Ruekert, R. W., & Walker Jr, O. C. (2002). Upper management control
of new product development projects and project performance. Journal of Product Innovation Management: AN
INTERNATIONAL PUBLICATION OF THE PRODUCT DEVELOPMENT & MANAGEMENT
ASSOCIATION, 19(3), 233-245.
Bowen,
P., Cattel, K., Hall, K., Edwards, P., & Pearl, R. (2012). Perceptions of
time, cost and quality management on building projects. Construction Economics and Building, 2(2), 48-56.
Copertari,
L. F. (2002). Time, cost and performance
tradeoffs in project management.
Forsberg,
K., Mooz, H., & Cotterman, H. (2000). Visualizing
project management: a model for business and professional sucess: John
Wiley and Sons.
Gardiner,
P. D., & Stewart, K. (2000). Revisiting the golden triangle of cost, time
and quality: the role of NPV in project control, success and failure. International journal of project management,
18(4), 251-256.
Hong,
L. C. (2011). Predictors of project performance and the likelihood of project
success.
Nidumolu,
S. R. (1996). Standardization, requirements uncertainty and software project
performance. Information &
Management, 31(3), 135-150.
Olson,
E. M., Walker Jr, O. C., Ruekerf, R. W., & Bonnerd, J. M. (2001). Patterns
of cooperation during new product development among marketing, operations, and
R&D: Implications for project performance. Journal of Product Innovation Management: An International Publication
of the Product Development & Management Association, 18(4), 258-271.
Pearlson,
K., & Saunders, C. (2001). Managing and Using Information Systems: A
Strategic Approach. 2001: USA: John Wiley & Sons.
Pinto,
J. K., & Slevin, D. P. (2015). 20. Critical Success Factors in Effective
Project implementation*.
PMI.
(2000). Project management body of
knowledge (PMBOK).
Pollack-Johnson,
B., & Liberatore, M. J. (2006). Incorporating quality considerations into
project time/cost tradeoff analysis and decision making. IEEE Transactions on engineering management, 53(4), 534-542.
Shankar,
N. R., Raju, M., Srikanth, G., & Bindu, P. H. (2014). Time, cost and
quality trade-off analysis in the construction of projects.
Thamhain,
H. J. (2004). Linkages of the project environment to performance: lessons for
team leadership. International journal of
project management, 22(7), 533-544.
Westland,
J. (2018). The Triple Constraint in Project Management: Time, Scope & Cost.
Wilson, R. (2015). Mastering
Project Time Management, Cost Control, and Quality Management: Proven Methods
for Controlling the Three Elements that Define Project Deliverables: FT
Press.
There are several areas of
information ethics in which the control of information is crucial. Four such
areas are privacy, accuracy, property, and accessibility (PAPA). The purpose of
this discussion is to address these critical areas in the context of the importance
of the control of information for ethical reasons. The discussion begins with
the ethical issues four building blocks of PAPA, followed by the control of
information and security measures which Enterprises must follow to protect the
privacy of users since it has been a significant
concern in IS domain.
Ethical Issues Building Blocks
In the 1990s, computer ethics became
a favorite topic in the research
community. One of the virus and worms
attacks called “ILoveYou” proliferated the computer ethics dilemma dramatically
(Harris, 2000). The estimated damage of this virus reached $10
billion worldwide, mostly in the loss of the work time. FBI estimates billions of dollars lost due to computer crimes. This virus has raised the red flag for
serious ethical issues faced by computer
users and IT Professionals. The Internet has increased the seriousness of
the ethical issues when using an information
system and computers (Harris, 2000).
The information system (IS) is
becoming boundless as organizations attempt to diminish costs, increase the
efficiency and develop strategic competitive advantages (Pearlson & Saunders,
2001).
However, these advantages exist in a business domain that lacks moral clarity.
Enterprises are under pressure to evaluate the current information
system with more focus on ethical
issues. The building blocks of ethical computing issues have not been clear to
many computer and information system users.
In the age of information system,
computers, internet, and digital world, (Mason, 2015) indicated that many unique challenges exist stemming from
the nature of information. However, although many ethical issues exist, focused
on four major ethical issues; privacy, accuracy, property, and accessibility (PAPA). Figure 1 shows these four building blocks with
their related critical questions.
Privacy is defined in today’s information-oriented
world as the ability of the individual to personally control information about
self (Pearlson & Saunders,
2001). Privacy has been a significant issue around the globe as users are concerned about
revealing and discoloring information that they do not want to make it public
or shared with other entities (Mason, 2015; Pearlson &
Saunders, 2001).
Accuracy represents
the correctness of the information. When the information presented does not
reflect the accurate information, it can cause serious issues. (Mason, 2015; Pearlson &
Saunders, 2001)
referred to a bank case where the
customer made a payment on a mortgage
which was not recorded in the bank system and eventually the bank took
foreclosed on the house. This example
shows how serious inaccurate information can cause to individuals.
The propertyrepresents
the owner of the data. The question of
intellectual property rights is one of the most complex issues. Organizations collect
information about customers, users, and
employees. The data gets stored either
internally or in the cloud. Who owns the
data is the question for the property ethical issue (Mason, 2015; Pearlson &
Saunders, 2001)
Accessibility raises the question about what information a person or organization have the right to access and obtain, under what condition, and what safeguards (Mason, 2015; Pearlson & Saunders, 2001).
Figure 1. PAPA Ethical Issues Model
based on (Mason, 2015; Pearlson &
Saunders, 2001).
Control of Information and Security Measures
(Abernathy & McMillan, 2016) identified personally identifiable information (PII) that can be used alone or with other information to identify a single person. PII includes full name, an identification number such as driving license, social security, date of birth and so forth. Enterprises must ensure that they understand international, national, state and local regulations and laws regarding the PII. Figure 2 shows the magnitude of personal data.
Figure 2. PII Complex List of Personal Data
(Abernathy & McMillan,
2016).
Various regulations and policies
have been established around the world to protect the privacy of the
individuals (Abernathy & McMillan,
2016; Pearlson & Saunders, 2001). In the U.S., privacy legislation
includes the 1974 Privacy Act which
regulates the government’s collection and use of personal information and the 1998 Children’s Online
Privacy Protection Action which regulates the online collection and use of
children’s personal information. Other regulations are industry-based
legislation to protect the privacy of the individuals such as the Gramm-Leach-Bliley Act of 1999 and the Health Insurance Portability and Accountability
Act (HIPAA) of 1996. Gramm-Leach-Bliley
Act of 1999 was issued because banks were
selling sensitive information about their customers such as social security
number, credit card purchase history to telemarketing companies. This law has mitigated sharing such sensitive
information with other entities. HIPAA
was issued to safeguard the electronic exchange privacy and security of the
information in the healthcare industry. Patients’ records must be protected from unauthorized access,
manipulation, and transmissions (Abernathy & McMillan,
2016; Pearlson & Saunders, 2001).
Various studies have discussed the
ethical issues in information system domain (Harris, 2000; Kuzu, 2009;
Ponelis, 2013). Organizations are under pressure to protect
the privacy of the users in the age of information system, computers, and the Internet. They should limit inappropriate access to
customers’ information to respect the privacy of their customers, users, and employees (Pearlson & Saunders,
2001). Security measures must be implemented to
ensure the appropriate data protection so that nonauthorized users and
malicious attacks can be prevented and mitigated. These security measures can be a firewall, authentication, authorization, access
control, and encryption. At the network
level when data is moving from one system to another, security measures include
secure socket layer (SSL) protocol, Transport
Layer Security (TLS) protocol, secure IP (IPSec), secure HTTP (HTTPS), secure
email (S/MIME) (Kuzu, 2009). When using cloud computing, the security measures to
protect the privacy and the integrity of the data are more complicated as cloud
computing has different service models, and different deployment models (Kumar, Ranjan, &
Gangwar, 2012).
Organizations must evaluate the options for selecting the appropriate security
measure not only to protect themselves
from outrageous fines and penalties but also to protect the privacy of the
users.
Conclusion
This discussion addressed critical
ethical issues using the privacy, accuracy, property, and accessibility (PAPA)
model of (Mason, 2015). These ethical issues raise
the flag to protect data from unauthorized user access, from sharing private
information, or from any malicious attacks that can cause loss of data or data
breach. Enterprises
are under pressure to ensure the protection of the user’s information. Various
security measures can be implemented at the
various level of the information system
for data at rest or data in motion. For
data in motion, security measures such as SSL, HTTPS, and IPSec can be
implemented to protect data. For data at
rest, security measures can include encryption and access control. Organizations should take into consideration
additional security measures to control access to information, especially when using cloud computing.
References
Abernathy, R., & McMillan, T.
(2016). CISSP Cert Guide: Pearson IT
Certification.
Harris, A. L.
(2000). IS ethical attitudes among
college students: A comparative study.
Kumar, A.,
Ranjan, A., & Gangwar, U. (2012). An understanding approach towards cloud
computing. International Journal of
Emerging Technology and Advanced Engineering, 2(9).
Kuzu, A. (2009).
Problems Related to Computer Ethics: Origins of the Problems and Suggested
Solutions. Online Submission, 8(2).
Mason, R. O.
(2015). Four ethical issues of the information age Computer Ethics (pp. 41-48): Routledge.
Pearlson, K.,
& Saunders, C. (2001). Managing and Using Information Systems: A Strategic
Approach. 2001: USA: John Wiley & Sons.
Ponelis,
S. (2013). Ethical risks of social media use by academic libraries. Innovation: journal of appropriate
librarianship and information work in Southern Africa, 2013(47), 231-244.
The purpose of this project is to discuss significant sourcing topics such as insourcing, outsourcing, offshoring, near-shoring, and captive center. Executives and leaders are confronted with critical decisions to either insource or outsource and between make or buy. Various factors affect their decisions to go for insourcing such as design secrecy, unreliable vendors, maintaining core competencies. Other supporting elements that can aid Enterprises in their decisions to go for outsourcing instead of insourcing such as cost reduction for small projects, limited numbers of employees, the requirement for highly educated with specific skills professionals. When organizations decide to go for outsourcing another critical decision to be made is to go for offshoring or near-shoring or captive centers. Offshoring has various challenges such as cultural differences, language barriers, and distance, while near-shoring can be an appropriate option which does not have these challenges that off-shoring has. Organizations decide to go for captive centers as an alternative for offshoring by developing an overseas subsidiary. In summary, Enterprises are confronted with various sourcing options, and they must weigh the benefits and the drawbacks of each option based on the strategic goal and objectives of the business and the requirements to achieve these objectives.
Enterprises are confronted with various decisions
challenges regarding insourcing or
outsource which means to make in-house or to buy from external sources (Baldwin, Irani, & Love, 2001; Kumari & Kumar, 2013; Pearlson
& Saunders, 2001). The decisions are challenges as they involve
considerable complexity and business risks. Each approach has its benefits and
drawbacks. Organizations must carefully
examine each method and determine the
best fit for their business based on its
strategic goal and objectives. This
project discusses the decision factors for each approach,
and the discussion will expand to other related topics when organizations
decide to outsource such as off-shore, near-shore and captive centers. The discussion
begins with the decision cycle framework for business sources, followed by the
insourcing approach decision factors.
In the
mid-1990s, Cognizant Technology Solutions proliferated
to become a $1.4 billion revenue company providing information technology (IT)
outsourcing services (Pearlson & Saunders, 2001). Outsourcing and insourcing are challenging
decision-making process with which executives and leaders typically are confronted.
Careful examination and analysis are
required before making the decision
for insourcing or outsourcing.
For Enterprises, sourcing involves many decisions evolving around the sourcing decision cycle framework (Pearlson & Saunders, 2001). The sourcing decision cycle framework begins with the decision to make or buy, followed by outsourcing or insourcing. When the decision is to outsource, then the next decision is to offshore or nearshore. The offshore decision is usually associated with cheap labor, or the required skills are more readily available. The next decision will be to go to a close country or in a country that is quite far. Organizations then are confronted with other decision to go captive center, far-shoring or near-shoring. When organizations settle on the outsourcing provider, and after a while, it is confronted with another decision, as periodically the organization must evaluate the arrangement and determine whether a modification or shift is in place. When the in-house work is not satisfactory, or other opportunities become available, the organization may decide to outsource. When outsourcing arrangement is not satisfactory, organizations have several options to consider, either to correct the existing problems, or to continue outsourcing with its current provider, or to outsource with another provider or to back-source. Figure 1 illustrates the sourcing decision cycle framework which organizations go through when making decisions to outsource or insource.
When
organizations delegate jobs to another entity within the organization, it is defined as insourcing. The in-house entity possesses a dedicated panel who will be
expert in providing the requisite services. Insourcing is also described as transferring work from one organization to
another organization which is located within a
similar country and not outside the country (Kumari & Kumar, 2013). Insourcing can also mean that an organization develops an innovative business
center with a set of skills focusing on a particular service or product. Insourcing is defined in (Lejeck, 2016) as the return of
functionality to the company, increasing the number
of resources and personnel in organizations.
Insourcing
is the most traditional approach where enterprises provide information system (IS) services or develop IS on-premise
or in-house (Pearlson & Saunders, 2001). Factors which support insourcing, among which
the most common factor is to keep the competencies inside the
organization. Some argue that if an
organization outsource the core competency, it can lose control over that
competency or lose contact with suppliers who can assist in staying innovative about competency
(Kumari & Kumar, 2013; Pearlson & Saunders,
2001). There is an increasing trend in the insourcing trend in insourcing approach to reducing the cost of labor and taxes amongst
others (Kumari & Kumar, 2013).
(Hirschheim & Lacity, 2000) argued that insourcing
is the assessment process of the outsourcing option with the confirmation to
continue the use of the internal IT resources to achieve the same
objective of outsourcing. Fourteen
insourcing case studies were conducted to develop an in-depth understanding of
IT insourcing decisions and outcomes.
The study indicated four archetypes for insourcing. The archetype
plays an essential
role in conveying the fundamental
differences that exist in alternative ways organization approach IT insourcing (Hirschheim & Lacity, 2000). Archetype
1 is about senior executive to enable internal IT managers to cut costs. Archetype
2 is about IT managers terminate failing outsourcing contracts. Archetype
3 is about IT managers defend insourcing.
Archetype 4 is about senior
executives confirm the value of IT. The
authors indicated that outsourcing evaluations often result from the
frustrations caused by different stakeholder expectation and perceptions of IT
performance. Different perspectives of stakeholder set unrealistic performance
expectations for IT managers, leading to frustration,
loss of faith in internal IT management, and hopes that outsourcing vendors
will provide solutions.
There
are factors which support insourcing (Kumari & Kumar, 2013; Pearlson & Saunders,
2001). The cost analysis between buying or making favors the choice of
make. The process and the operations are integrated part of the system and
cannot be isolated, insourcing is preferred.
The use of available capacity to absorb fixed overhead is another factor
supporting insourcing. The operation
must be in-house for better quality and production control. Organizations prefer insourcing when the
design secrecy is required; the
insourcing is a better option (Kumari & Kumar, 2013; Pearlson & Saunders,
2001). When there is a lack of reliable suppliers,
insourcing is a wise choice (Kumari & Kumar, 2013). When organizations have to develop long-term Core Competencies for the
organization, it is better to go insourcing (Kumari & Kumar, 2013; Pearlson & Saunders,
2001). When the decision
for a process or product depends on the strategic
decision for the organization, insourcing
is the appropriate option (Kumari & Kumar, 2013). Insourcing approach is preferred when the time is available in-house to complete software development projects, and the IT
professionals are adequately trained, experienced and skilled to provide
service or develop software (Pearlson & Saunders, 2001).
Insourcing
has various challenges, some of which are dealing
with inadequate support from top management to acquire needed resources (Pearlson & Saunders, 2001). Another insourcing challenge is finding a reliable and competent outsourcing provider
who is likely to stay in business.
Insourcing
approach has advantages and disadvantages (Pearlson & Saunders, 2001). The advantages
of the insourcing approach include the high degree of control that
organizations have over inputs, the increase in the visibility over the
process, and the economies of scale and scope.
The disadvantages of insourcing approach include the requirement for
high volumes, high investment, dedicated equipment with limited use, and
problems with supply chain integration (Pearlson & Saunders, 2001).
Outsourcing
is the opposite of insourcing. The outsourcing option is the process of buying goods
or services that can be performed in-house or internally (Kumari & Kumar, 2013; Pearlson & Saunders,
2001). In the 1970s,
some IT managers took the outsourcing approach as an essential technique to control the cost (Pearlson & Saunders, 2001). IT outsourcing involves the outside vendor providing IT services traditionally
provided by the internal information system department. The motives for outsourcing have been broadened since then. The guiding principle of outsourcing approach
has been the transfer of a process and function
which is typically not a core competence of an enterprise to an entity that has
expertise in that area, allowing the enterprise to effectively utilize its
resources in its core areas of business (Kumari & Kumar, 2013). The objectives of the outsourcing include
saving on the cost of operation by
acquiring services from a team more productive than
the internal resources, and the improvement of quality and value of operation by acquiring
services from an entity with best practices in management that business
activity. Since these objectives require significant
investments in time and resources, over the last two years, many
well-structured outsourcing deals have failed to meet expectations (Kumari & Kumar, 2013). Outsourcing approach is increasingly perceived as a strategy that
can be used by businesses to leverage the skills
and competencies of a definable preeminence.
In a recent report by (Deloitte, 2018), a survey result showed that outsourcing is enabling competitive advantages. The same report indicates that organizations are embracing disruptive solutions such as cloud computing and robotic process automation (RPA) 93% are considering adopting cloud solution, and 72% are considering or adopting RPA solution, and 70% believe their service providers have a reasonable or advanced ability to implement disruptive solutions. The disruptive solutions are transforming the traditional outsourcing approach, as the cloud creates capabilities but cost counts. Figure 2 shows 93% of organizations are considering adopting the cloud, and 64% shows the objective to catalyze IT innovation when adopting the cloud.
Figure 2. Cloud Adoption One of the
Disruptive Solutions Transforming Traditional Outsourcing (Deloitte, 2018).
The same report also showed that organizations are addressing cyber risks when making decisions to outsource. Figure 3 shows how organizations are addressing cyber risks when making decisions to outsource.
Figure 3. Cyber Risk Consideration When
Outsourcing (Deloitte, 2018).
Some factors support outsourcing approaches. When
expert vendors are available with specialized know-how generating better output
with less cost, outsourcing approach can be a better choice (Kumari & Kumar, 2013; Pearlson & Saunders,
2001). When the cost of developing the required
competencies is less with outsourcing than with insourcing, outsourcing is the preferred option (Kumari & Kumar, 2013). When a business
does not have the capabilities or competencies to develop items or products,
the outsourcing approach is the better choice.
When a small volume is required, it will not be wise to choose to outsource for cost-effectiveness. When
organizations have limited numbers of employees, the outsourcing option is
preferred. When the volume of a product
is unknown and not certain, an organization can go with outsourcing.
Organizations can use outsourcing for better strategic focus, better management
of IS staff, cash infusion, data center consolidation, and smooth transition to new technologies (Pearlson & Saunders, 2001).
Outsourcing
approach has various challenges.
Maintaining an adequate level of control is one of the challenges that
organizations have to face. Maintaining the ability to respond to
technological innovation is another challenge for outsourcing approach. The avoid of a loss of strategic advantage,
and overreliance on outsourcing provider are challenges for outsourcing adoption. The mitigation of the risks associated with outsourcing
is another challenge. Ensuring the cost
savings while protecting the quality, and work effectively with suppliers are
additional challenges when adopting the outsourcing approach (Pearlson & Saunders, 2001).
Outsourcing
approach has advantages and disadvantages (Kumari & Kumar, 2013). Outsourcing approach has greater flexibility,
lower investment risk, improved cash flow, and lower potential labor cost. Additional benefits of the outsourcing
approach include the reduced costs, better service and access to new technology
and enabling employees to focus their effort on higher-value work that
improving output (Baldwin et al., 2001). The disadvantages of the outsourcing approach
include the greater possibility of choosing wrong suppliers and distributors,
loss of control over processes, the potential
for losing core supportive activities, long lead-times, and hollowing out (Kumari & Kumar, 2013).
The sourcing decision cycle
framework suggested by (Pearlson & Saunders, 2001) include shows that
outsourcing decision includes various types
such as off-shore, near-shore, or captive centers (Figure 1). This section discusses these types of outsourcing approach.
The
offshore outsourcing approach occurs when
the management information system (IS) uses services of contractors or develop a data center in a distant location (Pearlson & Saunders, 2001). The functions sent
offshore range from the traditional IT transactions to high-end,
knowledge-based business processes. Outsourcing offshore can save from 40% to 70%
in labor. However, these labor savings
come with other costs associated with additional technology,
telecommunications, travel process changes, and management overhead which are
required to relocate and supervise operations overseas. Organizations adopt the offshore outsourcing approach for other reasons
than the cost reduction. One of these
reasons is that the employees of these companies are highly educated (Kumari & Kumar, 2013; Pearlson & Saunders,
2001). The offshore
outsourcing providers are often profit centers, which have established
Six Sigma, ISO 9001, or another certification program (Pearlson & Saunders, 2001).
The
outsourcing near-shoring approach is a type of sourcing service work to a
foreign, lower-wage country which is relatively near or closes in distance or time zone or both (Pearlson & Saunders, 2001). It was
introduced as an alternative to far-shoring. Organizations can benefit from outsourcing
near-shoring geographically, culturally, linguistically, economically and
politically. Some argue that by being
close or nearby, the organization will face fewer
challenges regarding communications,
control, supervision, coordination or bonding socially (Pearlson & Saunders, 2001).
The
concept of captive center is an alternative to outsourcing offshore and
near-short approaches. The captive center is an overseas subsidiary
which is set up to serve the parent
company (Pearlson & Saunders, 2001). Organizations develop
captive centers as an alternative to offshoring approach. In the 1990s,
many companies developed captive centers to do software maintenance and
customer services. The captive center approach has four important strategies; hybrid captive shared captive, divest captive, and
terminated captive.
Although
offshoring approach has the lowest cost, Enterprises should carefully examine the offshoring option due to
the challenges that come along with offshoring such as cultural difference, language barriers, communication gap, time
zone differences, and regulations and policies (Corredor, 2018; Pearlson & Saunders, 2001).
Near-shoring
is an alternative option which also offers significant
cost efficiencies. Near-shoring has more advantages
over the offshoring as it has time and geographic proximity. The timezone and physical proximity of near-shoring
approach provide a significant advantage over more distant locations (Corredor, 2018; Pearlson & Saunders, 2001). The culture similarity is another benefit of
the outsourcing near-shoring approach.
The labor pool and cost attractiveness are additional benefits of the
near-shoring for decision consideration.
This
project discussed major sourcing topics such as insourcing, outsourcing,
offshoring, near-shoring, and captive
center. Executives and leaders are confronted with a critical decision to either insource or outsource and between make or
buy. Various factors affect their decisions to go for insourcing such as design
secrecy, unreliable vendors, maintaining core competencies. Other
supporting factors that can aid Enterprises in their decisions to go for
outsourcing instead of insourcing such as cost reduction for small projects,
limited numbers of employees, the requirement for highly educated with specific skills professionals. When organizations decide to go for
outsourcing another critical decision to be made is to go for offshoring or
near-shoring or captive centers.
Offshoring has various challenges such as cultural differences, language barriers, and distance, while
near-shoring can be an appropriate option which does not have these challenges
that off-shoring has. Organizations
decide to go for captive centers as an alternative for offshoring by developing
an overseas subsidiary. In summary, executives
are confronted with various sourcing
options, and they must weigh the benefits
and the drawbacks of each option based on the strategic goal and objectives of
the business and the requirements to achieve these objectives.
Baldwin, L. P., Irani,
Z., & Love, P. E. (2001). Outsourcing information systems: drawing lessons
from a banking case study. European
Journal of Information Systems, 10(1), 15-24.
Corredor,
F. (2018). 4 Reasons Why You Should Consider Nearshoring Vs. Offshoring.
The purpose of this discussion is to address Big Data (BD) and the challenges associated with BD in the context of business analytics. The discussion begins with a brief overview of Big Data and Big Data Analytics, followed by the challenges. Cloud computing solution is also discussed as well as the role of BD in ERP.
Big Data Brief Overview
Big Data is now the buzzword in the field of computer science and information
technology. Big Data attracted the
attention of various sectors, researchers, academia, government and even the
media (Géczy, 2014;
Kaisler, Armour, Espinosa, & Money, 2013). In the
2011 report of the International Data Corporation (IDC), it is reporting that
the amount of the information which will be
created and replicated will exceed
1.8 zettabytes which are 1.8 trillion
gigabytes in 2011. This amount of information is growing by a factor of 9 in
just five years (Gantz & Reinsel,
2011). Big Data and Big Data Analytic are terms that have been used interchangeably (Maltby, 2011). Big Data has unique characteristics that are identified as challenging using traditional technology.
Big Data (BD) has been characterized by what is often referred to as a multi-V model such as variety, velocity, volume, veracity, and value (Assunção, Calheiros, Bianchi, Netto, & Buyya, 2015). While variety represents the data types, the velocity reflects the rate at which the data is produced and processed (Assunção et al., 2015). The volume defines the amount of data, and the veracity reflects how much the data can be trusted given the reliability of its source. The value, on the other hand, represents the monetary worth which organizations can derive from adopting Big Data computing. Figure 1 summarizes these characteristics.
Big Data (BD) has been characterized by what is often referred to as a multi-V model such as variety, velocity, volume, veracity, and value (Assunção, Calheiros, Bianchi, Netto, & Buyya, 2015). While variety represents the data types, the velocity reflects the rate at which the data is produced and processed (Assunção et al., 2015). The volume defines the amount of data, and the veracity reflects how much the data can be trusted given the reliability of its source. The value, on the other hand, represents the monetary worth which organizations can derive from adopting Big Data computing. Figure 1 summarizes these characteristics.
Figure 1. Big Data Multi-V Model (Assunção et al., 2015).
The variety characteristic of the Big Data reflects the data types (Assunção et al., 2015). The data types are further categorized into the structure, unstructured, semi-structured and mixed. The structured data represents the formal schema and data models, while the unstructured reflects no pre-defined data model, and semi-structured lacked strict data model structure and mixed as the term indicates that various types together (Assunção et al., 2015). Figure 2 summarizes these data types in the Big Data.
Figure 2. Variety Characteristic of Big Data (Assunção et al., 2015).
The velocity characteristics of the Big Data represents the speed or arrival and the processing of the data which have been characterized into the batch, near-time, real-time, and streams according to (Assunção et al., 2015). The batch reflects the at time intervals, while near-time refers to at small time intervals. The real-time, on the other hand, represents the continuous input, process, and output, while the streams refer to data flows (Assunção et al., 2015). Figure 3 summarizes these characteristics of the velocity feature of the Big Data.
Figure 3. Velocity Characteristic of Big Data(Assunção et al., 2015).
Big Data Challenges
With these
characteristics of Big Data, including the growth rate, challenges and issues
have come along (Jagadish et al., 2014; Meeker & Hong, 2014; Misra, Sharma, Gulia,
& Bana, 2014; Nasser & Tariq, 2015; Zhou, Chawla, Jin, & Williams,
2014).
The growth rate in the amount of data is regarded to be a significant challenge for IT researchers and
practitioners to design appropriate systems that handle the data effectively
and analyze it to extract relevant meaning for decision-making
(Kaisler et al., 2013). Various challenges and issues of the Big Data have been discussed and
analyzed in multiple research studies, such as data storage, data management,
and data processing (Fernández et al., 2014; Kaisler et al., 2013); Big Data variety, Big Data integration and cleaning,
Big Data reduction, Big Data query and indexing, and Bid Data analysis and mining
(J. Chen et al., 2013).
Extracting a meaningful value from the Big Data is a significant challenge (Fernández et al., 2014; Sagiroglu & Sinanc, 2013). Three factors must be taken into consideration to create value from Big Data (Chopra & Madan, 2015). These three factors include the user control
over the data, the security issues to be taken seriously, and the examination
of safety points on a yearly basis. (Chopra & Madan, 2015) suggested that businesses and organizations, which follow those
factors, will distinguish themselves by gaining market initiatives. Other research studies such as (Labrinidis & Jagadish, 2012) suggested that the value obtained from the analysis of the data is
broadly recognized, but the analysis of the data is regarded to be challenging
due to the challenging characteristics of the Big Data. Other research studies
such as (Assunção et al., 2015; Chopra & Madan, 2015) have indicated that the
complexity of Big Data is preventing organization to realize its benefit and
causing a business to step back from the
Big Data deployment and implementation.
Big Data Analytics and Cloud Computing Solution
The challenges of BD and BDA such as data storage, data
management, data processing, and
data-intensive computational requirements required solutions as the traditional
technology was found inadequate (Fernández et al., 2014; Hu, Wen, Chua, & Li, 2014). As indicated above, one of the significant challenges
is extracting a meaningful value from BD.
BD and BDA require advanced and unique
data storage, management, analysis, intensive computing, and visualization technologies
(H. Chen, Chiang, & Storey, 2012; J. Chen et al.,
2013). Cloud computing emerging technology has been
meeting these requirements and serving as a solution and platform to BD and BDA
challenges.
Cloud computing plays a significant role in Big Data Analytics (Assunção et al., 2015). The massive
computation and storage requirement of the BD and BDA brings the critical need
for cloud computing (Mehmood, Natgunanathan, Xiang, Hua, & Guo, 2016). Cloud computing is currently the biggest buzz in the
information technology, computer science industry, in the computer world, and the
distributed computing community (Dhanani, 2014; Saini & Sharma, 2014). It is being positioned as the “next wave of
computing” (Mvelase, Dlodlo, Makitla, Sibiya, & Adigun, 2012,
p. 214). The use of cloud computing technology in conjunction with
data has been the more recent trend for BDA
(Wang, Kung, & Byrd, 2018). Organizations have increasingly adopted BD
and BDA in the cloud, particularly, the
Software-as-a-Service (SaaS) cloud service model, which offers an attractive
alternative with lower cost (Wang et al., 2018). Cloud computing
technology for BDA systems supporting a real-time analytic capability and
cost-effective storage is becoming a preferred information technology solution (Wang et al., 2018). The cloud
computing technology is the solution and the answer to the challenges of BD and BDA (Fernández et al., 2014). Organizations and businesses are under
pressure to quickly adopt and implement technologies such as cloud computing to
address the challenges of Big Data (Hashem et al., 2015).
Big Data Analytics Role in
ERP
Big Data Analytics plays a significant role in ERP
applications (Carlton, 2014; ERP Solutions, 2018; Woodie, 2016). Enterprise data comprises various departments
such as HR, finance, CRM and other essential business functions of a
business. This data can be leveraged to
make ERP functionality better. When Big
Data tools are brought together with the ERP
system, it can unfold valuable insights that can businesses make smarter
decisions (Carlton, 2014; Cornell University, 2017; Wailgum,
2018).
Many ERP systems fail to make use of real-time inventory and supply chains data because these systems lack the intelligence
to make predictions about products demands (Carlton, 2014; ERP Solutions, 2018). Big Data tools can predict
demand and help determine the needs of the organization to go forward (ERP Solutions, 2018).
Infor co-president Duncan Angove established Dynamic Science Labs (DSL)
aiming to use data science techniques to solve particular
business problems for its customers. Employees with big data, math, and coding skills were hired in Cambridge, Massachusetts-based organization to
develop proof of concept (POC) (Woodie, 2016).
Big Data systems such as Apache’s Hadoop are creating node-level
operating transparencies which affect nearly every current ERP module in
real-time (Carlton, 2014).
Managers will be able to quickly leverage ERP Big Data capabilities,
thereby enhancing information density and speeding up overall decision-making.
In brief, Big Data and Big Data Analytics impact
business at all levels, and ERP is no
exception.
Conclusion
Big Data (BD) and Big Data Analytics (BDA) have been
the buzzwords across various industries from academic, research, practitioners,
media and government. BD has been characterized by certain features such as volume, variety, and velocity which were the first V-model of
BD. The traditional technology and
systems were found inadequate to deal with
and handle BD. The explosive growth of
the data in various forms such as structured, unstructured and semi-structured, and the speed of the growth and
the required speed for processing the data demanded technologies that can deal
with these unique characteristics. Cloud computing emerging technology was found
to provide a solution when applying BD
and BDA for storage and computation.
Other technologies include Hadoop, MapReduce, Spark and so forth. BD and BDA play a crucial role in Enterprise Resource Planning (ERP). Organizations
are under pressure to take advantage of BD and BDA to become competitive and
stay competitive in the age of the digital
world and the era of Big Data and Big Data Analytics.
References
Assunção, M. D.,
Calheiros, R. N., Bianchi, S., Netto, M. A. S., & Buyya, R. (2015). Big
Data Computing and Clouds: Trends and Future Directions. Journal of Parallel and Distributed Computing, 79, 3-15.
doi:10.1016/j.jpdc.2014.08.003
Chen, H., Chiang,
R. H. L., & Storey, V. C. (2012). Business Intelligence and Analytics: From
Big Data to Big Impact. MIS Quarterly, 36(4),
1165-1188.
Chen, J., Chen,
Y., Du, X., Li, C., Lu, J., Zhao, S., & Zhou, X. (2013). Big Data
Challenge: a Data Management Perspective. Frontiers
of Computer Science, 7(2), 157-164. doi:10.1007/s11704-013-3903-7
Chopra, A., &
Madan, S. (2015). Big Data: A Trouble or A Real Solution? International Journal of Computer Science Issues, 12(2), 221.
Dhanani, M.
(2014). Cloud Security: Privacy and Data Protection. Department of Computer Science and Software Engineering, University of
Canterbury, New Zealand.
Fernández, A.,
Del Río, S., López, V., Bawakid, A., del Jesus, M. J., Benítez, J. M., &
Herrera, F. (2014). Big Data with Cloud Computing: An Insight on the Computing
Environment, MapReduce, and Programming Frameworks. Wiley Interdisciplinary Reviews: Data Mining and Knowledge Discovery, 4(5),
380-409. doi:10.1002/widm.1134
Gantz, J., &
Reinsel, D. (2011). Extracting Value From Chaos. International Data Corporation, 1142, 1-12.
Géczy, P. (2014).
Big data characteristics. The Macrotheme
Review, 3(6), 94-104.
Hashem, I. A. T.,
Yaqoob, I., Anuar, N. B., Mokhtar, S., Gani, A., & Khan, S. U. (2015). The
Rise of “Big Data” on Cloud Computing: Review and Open Research Issues. Information Systems, 47, 98-115.
doi:10.1016/j.is.2014.07.006
Hu, H., Wen, Y.,
Chua, T., & Li, X. (2014). Toward Scalable Systems for Big Data Analytics:
A Technology Tutorial. Practical
Innovation, Open Solution, 2, 652-687. doi:10.1109/ACCESS.2014.2332453
Jagadish, H. V.,
Gehrke, J., Labrinidis, A., Papakonstantinou, Y., Patel, J. M., Ramakrishnan,
R., & Shahabi, C. (2014). Big Data and Its Technical Challenges. Communications of the Association for
Computing Machinery, 57(7), 86-94. doi:10.1145/2611567
Kaisler, S.,
Armour, F., Espinosa, J. A., & Money, W. (2013). Big Data: Issues and Challenges Moving Forward. Paper presented at
the Hawaii International Conference on System Sciences
Labrinidis, A.,
& Jagadish, H. V. (2012). Challenges and Opportunities with Big Data. International Conference on Very Large Data
Bases, 5(12), 2032-2033.
Maltby, D.
(2011). Big Data Analytics. Paper
presented at the Annual Meeting of the Association for Information Science and
Technology.
Meeker, W., &
Hong, Y. (2014). Reliability Meets Big Data: Opportunities and Challenges. Quality Engineering, 26(1), 102-116.
doi:10.1080/08982112.2014.846119
Mehmood, A.,
Natgunanathan, I., Xiang, Y., Hua, G., & Guo, S. (2016). Protection of Big
Data Privacy. Institute of Electrical and
Electronic Engineers, 4, 1821-1834. doi:10.1109/ACCESS.2016.2558446
Misra, A.,
Sharma, A., Gulia, P., & Bana, A. (2014). Big Data: Challenges and
Opportunities. International Journal of
Innovative Technology and Exploring Engineering, 4(2).
Mvelase, P.,
Dlodlo, N., Makitla, I., Sibiya, G., & Adigun, M. (2012). An Architecture Based on SOA and Virtual
Enterprise Principles: OpenNebula for Cloud Deployment, Reading.
Nasser, T., &
Tariq, R. S. (2015). Big Data Challenges. Journal
of Computer Engineering & Information Technology, 9307, 1-10.
doi:10.4172/2324
Sagiroglu, S.,
& Sinanc, D. (2013). Big Data: A
Review. Paper presented at the International Conference: Collaboration
Technologies and Systems.
Saini, G., &
Sharma, N. (2014). Triple Security of Data in Cloud Computing. International Journal of Computer Science
and Information Technologies, 5(4), 5825-5827.
Wang, Y., Kung,
L. A., & Byrd, T. A. (2018). Big Data Analytics: Understanding its
Capabilities and Potential Benefits for Healthcare Organizations. Technological Forecasting and Social Change,
126, 3-13. doi:10.1016/j.techfore.2015.12.019
Zhou,
Z., Chawla, N., Jin, Y., & Williams, G. (2014). Big Data Opportunities and
Challenges: Discussions from Data Analytics Perspectives. Institute of Electrical and Electronic Engineers: Computational
Intelligence Magazine, 9(4), 62-74.